Tendermint Core QA Results v0.34.x
200 Node Testnet
Finding the Saturation Point
The first goal when examining the results of the tests is identifying the saturation point. The saturation point is a setup with a transaction load large enough to prevent the testnet from being stable: the load runner tries to produce slightly more transactions than can be processed by the testnet. The following table summarizes the results for v0.34.x for the different experiments (extracted from filev034_report_tabbed.txt).
The X axis of this table is c, the number of connections created by the load runner process to the target node.
The Y axis of this table is r, the rate or number of transactions issued per second.
| c=1 | c=2 | c=4 | |
|---|---|---|---|
| r=25 | 2225 | 4450 | 8900 |
| r=50 | 4450 | 8900 | 17800 |
| r=100 | 8900 | 17800 | 35600 |
| r=200 | 17800 | 35600 | 38660 |
c)
to a chosen validator and the number of transactions per second that the load runner
tries to produce (r). Note that the overall load the tool attempts to generate is .
We can see that the saturation point is beyond the diagonal that spans cells
r=200,c=2r=100,c=4
r=200,c=4) have in common that the total
number of transactions processed is noticeably less than the product (89 seconds, since the last batch never gets sent),
which is the expected number of transactions when the system is able to handle the load well.
With (r=200,c=4), we obtained 38660, whereas the theoretical number of transactions should
have been .
At this point, we chose an experiment at the limit of the saturation diagonal
in order to further study the performance of this release.
The chosen experiment is (r=200,c=2).
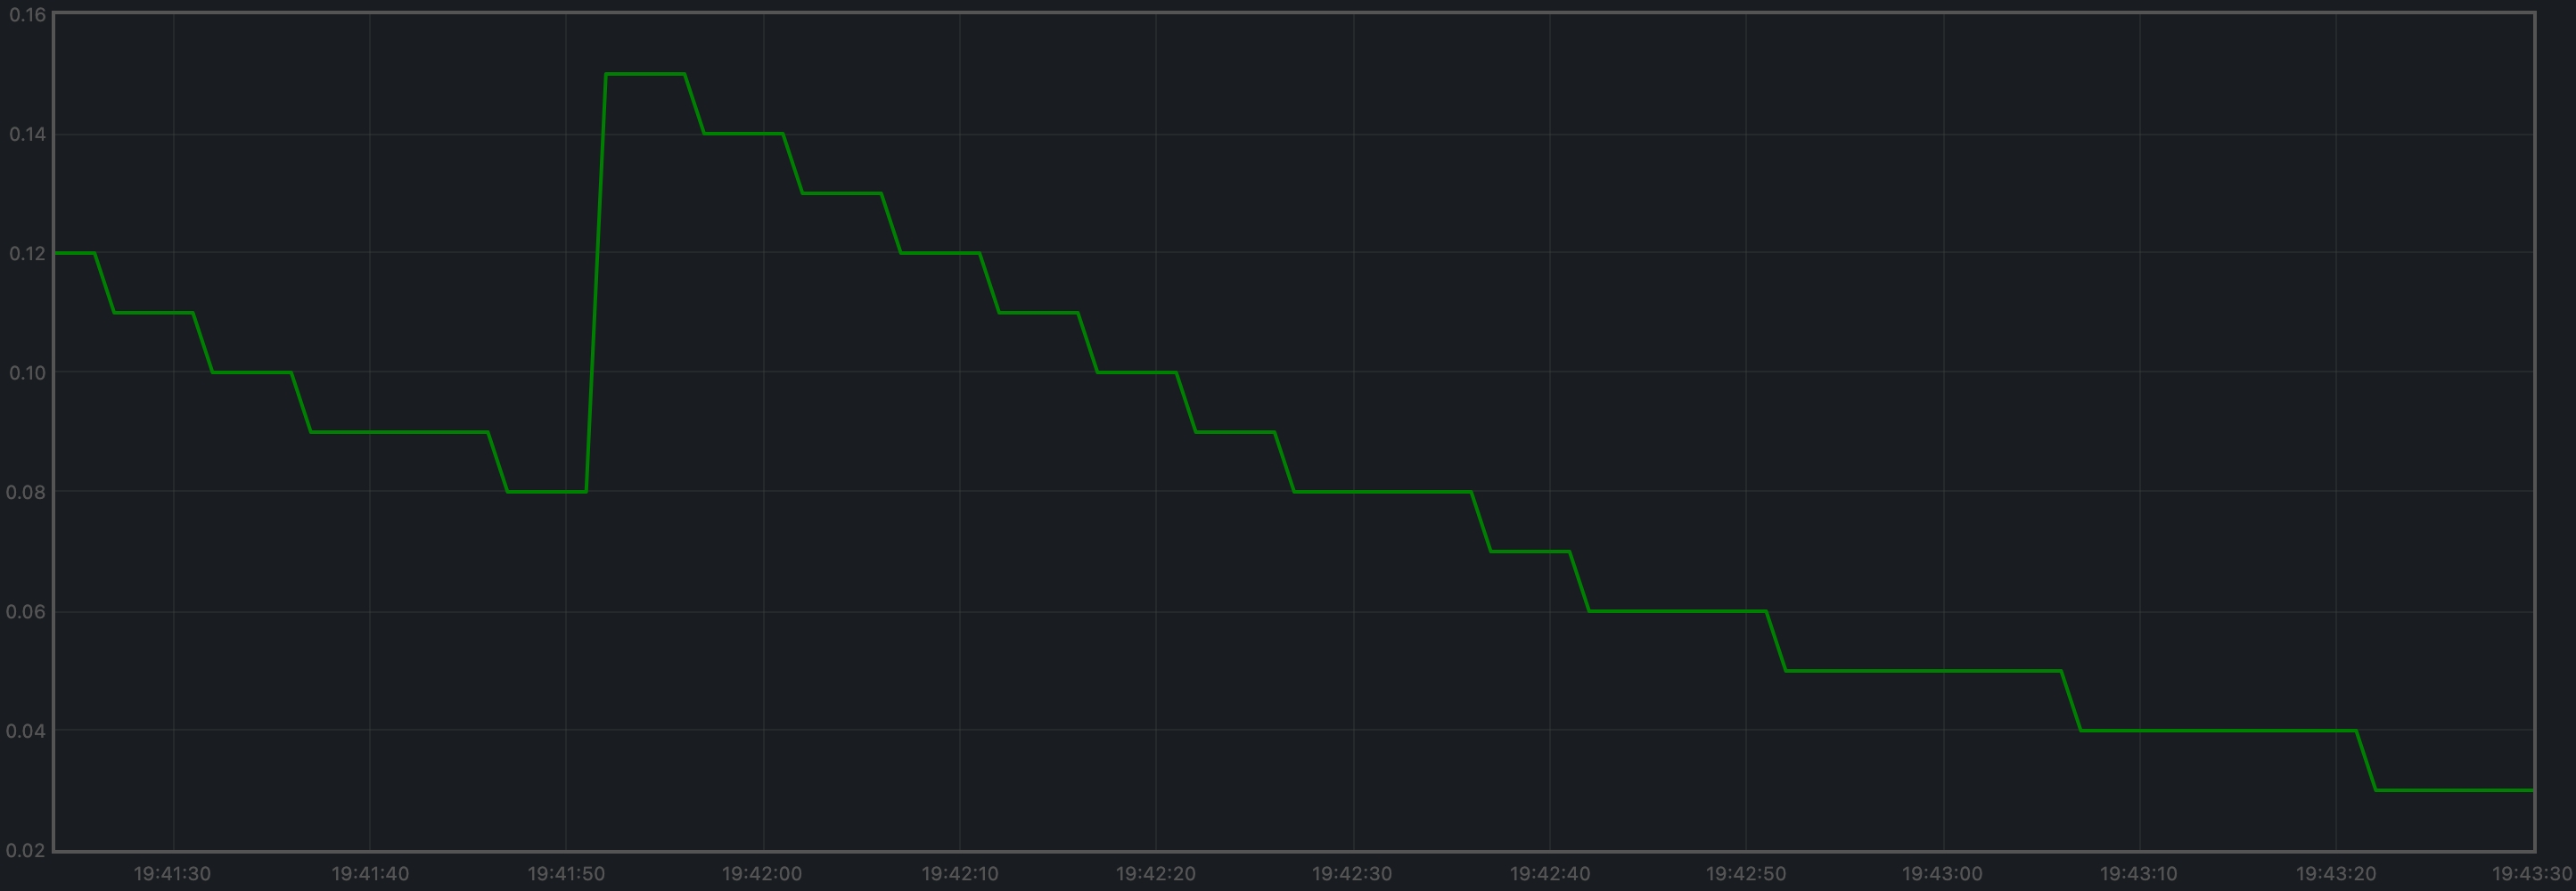
This is a plot of the CPU load (average over 1 minute, as output by top) of the load runner for (r=200,c=2),
where we can see that the load stays close to 0 most of the time.
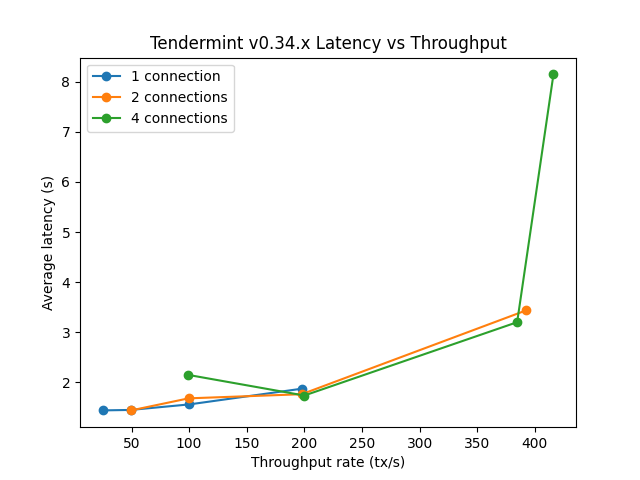
Examining Latencies
The method described here allows us to plot the latencies of transactions for all experiments.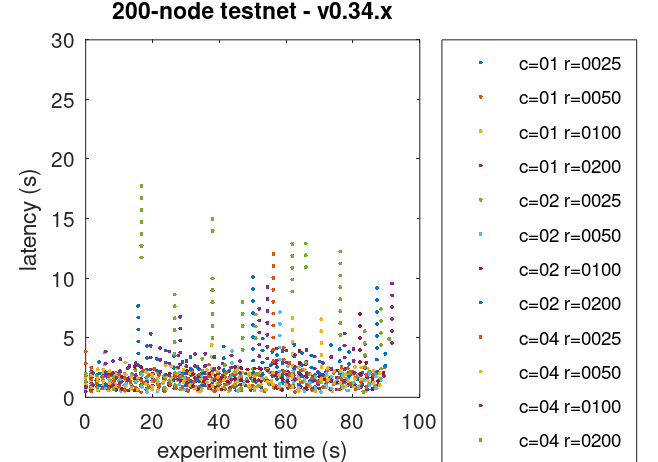
Prometheus Metrics on the Chosen Experiment
As mentioned above, the chosen experiment isr=200,c=2.
This section further examines key metrics for this experiment extracted from Prometheus data.
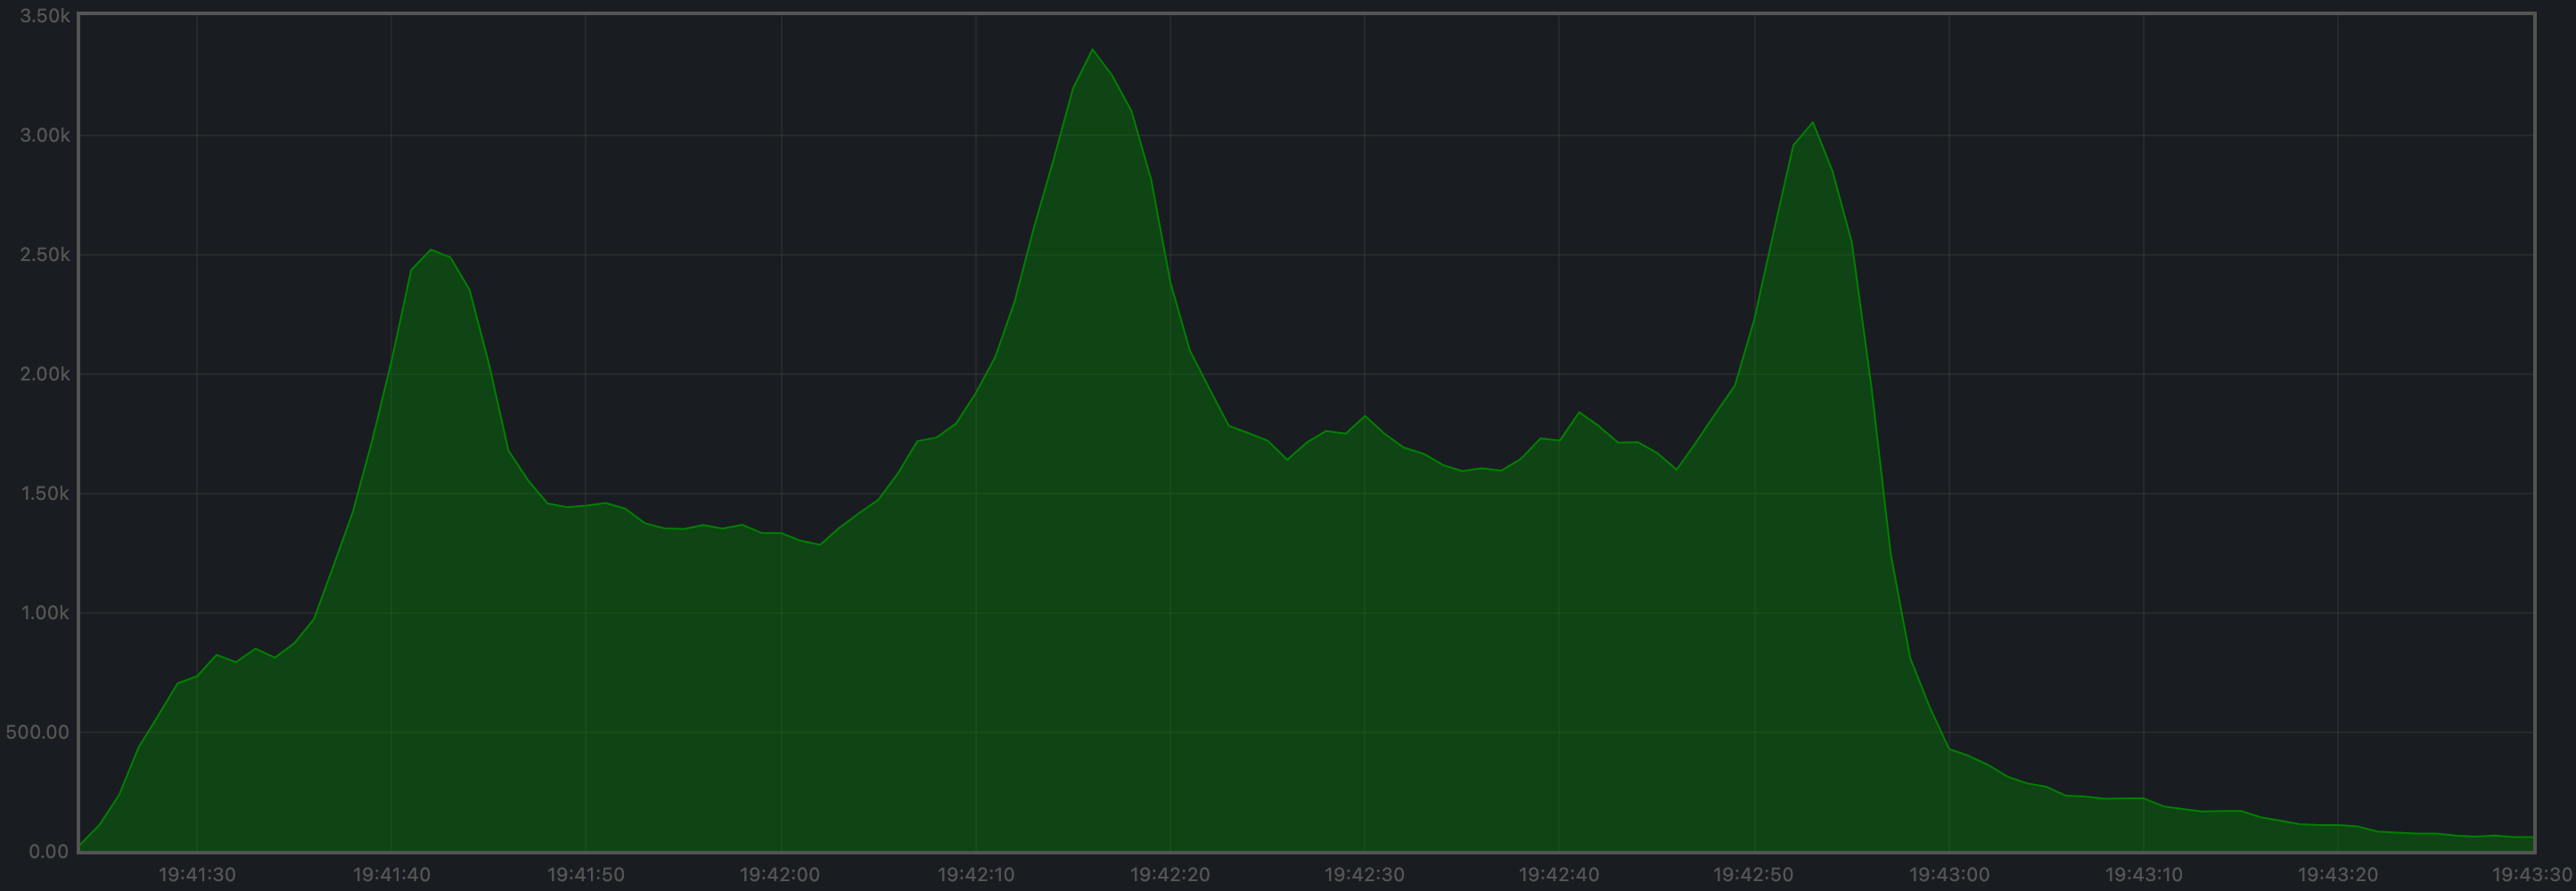
Mempool Size
The mempool size, a count of the number of transactions in the mempool, was shown to be stable and homogeneous at all full nodes. It did not exhibit any unconstrained growth. The plot below shows the evolution over time of the cumulative number of transactions inside all full nodes’ mempools at a given time. The two spikes that can be observed correspond to a period where consensus instances proceeded beyond the initial round at some nodes.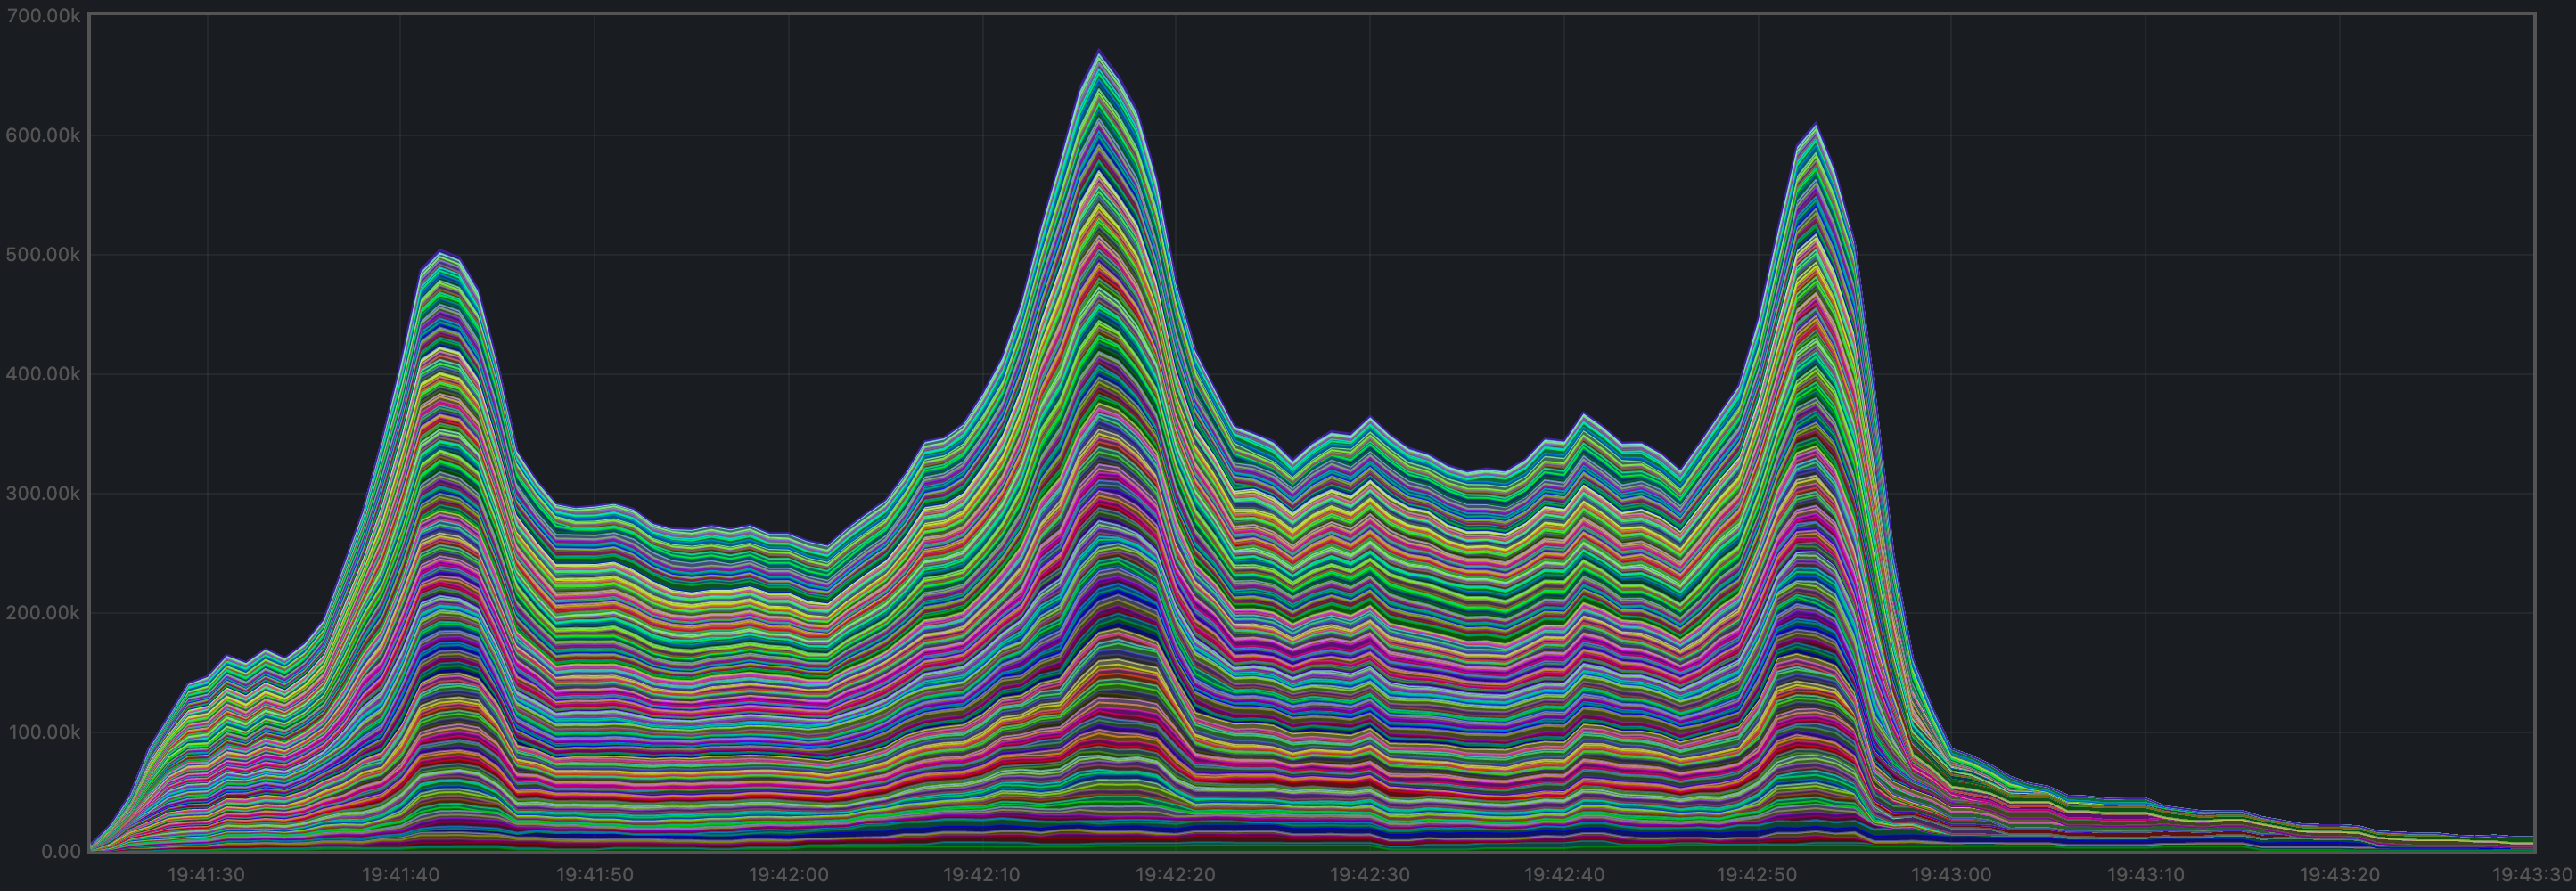
Peers
The number of peers was stable at all nodes. It was higher for the seed nodes (around 140) than for the rest (between 21 and 74). The fact that non-seed nodes reach more than 50 peers is due to #9548.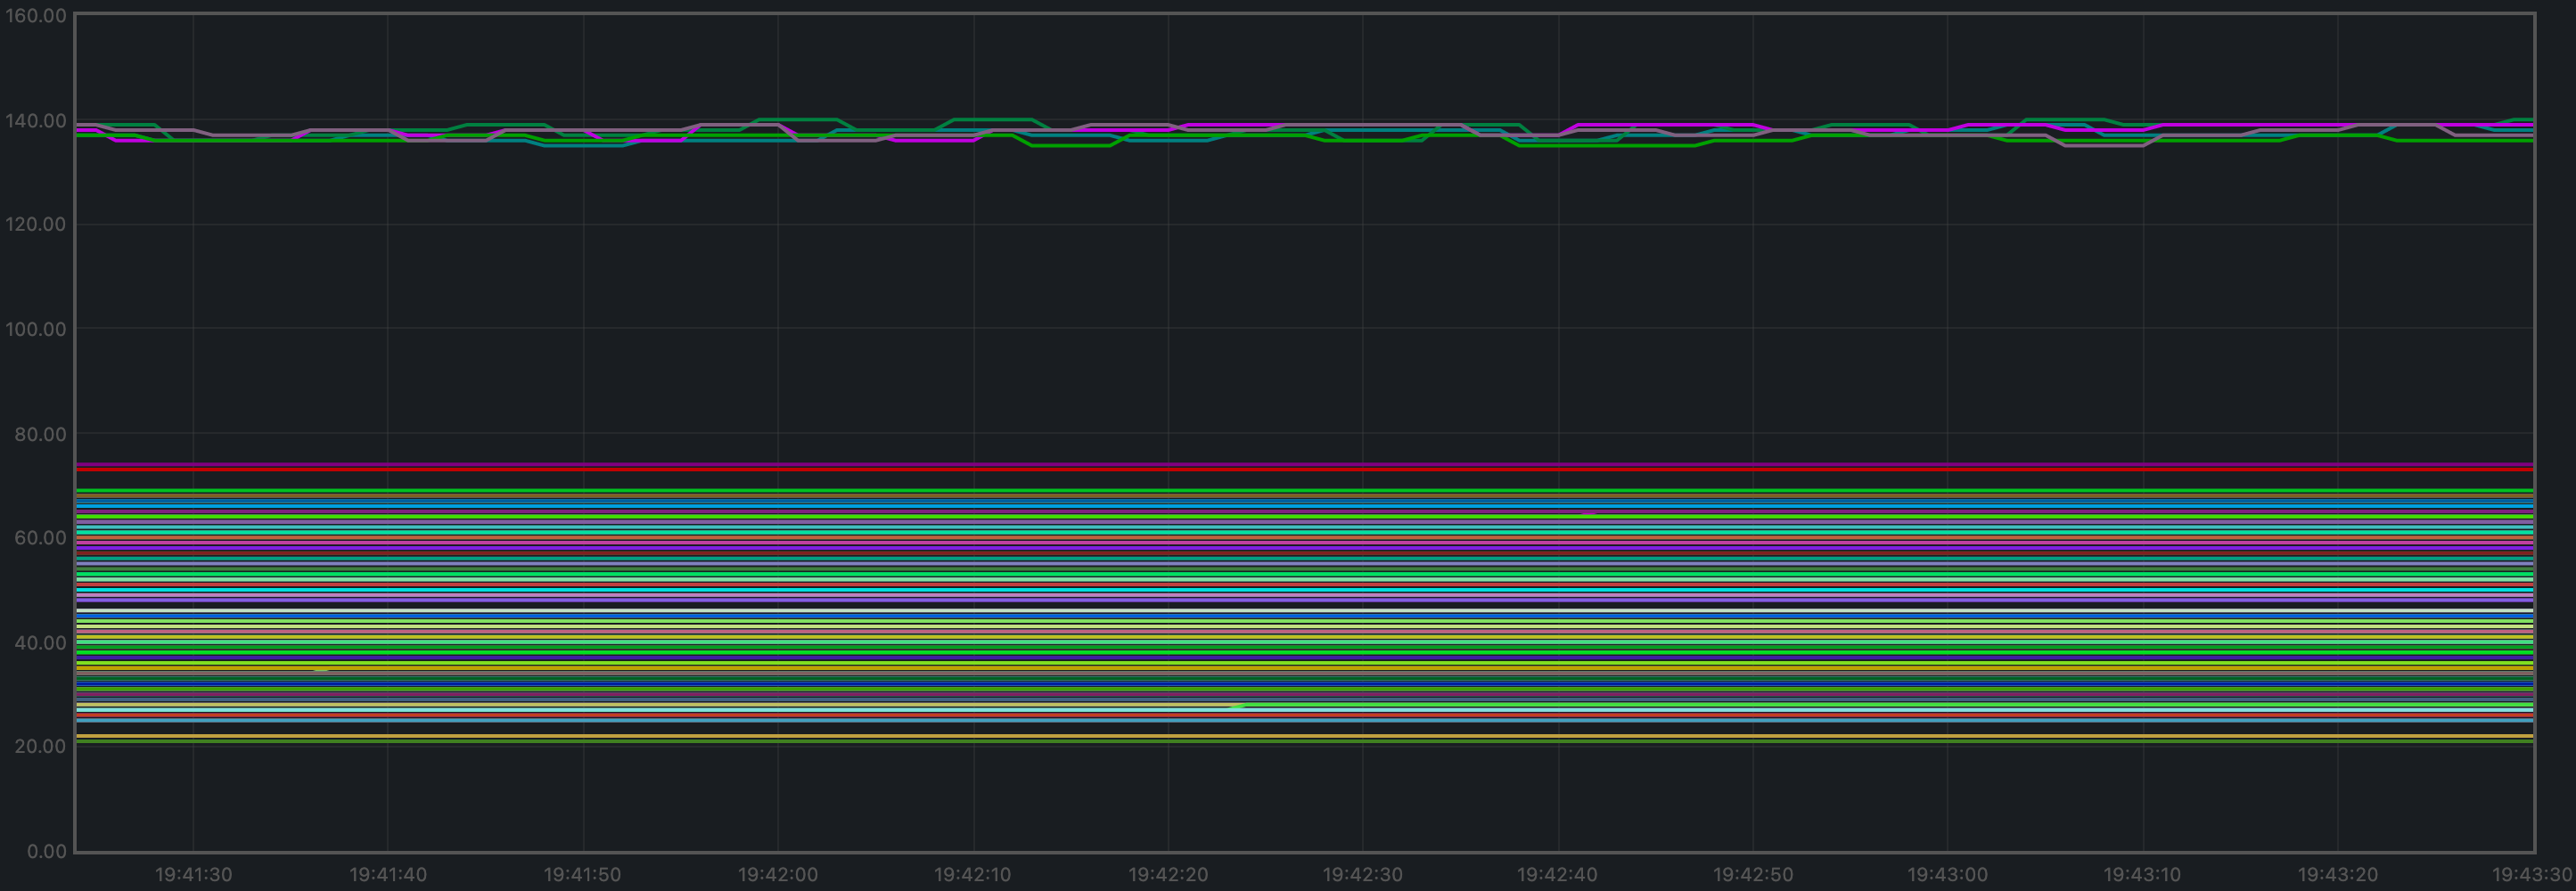
Consensus Rounds per Height
Most nodes used only round 0 for most heights, but some nodes needed to advance to round 1 for some heights.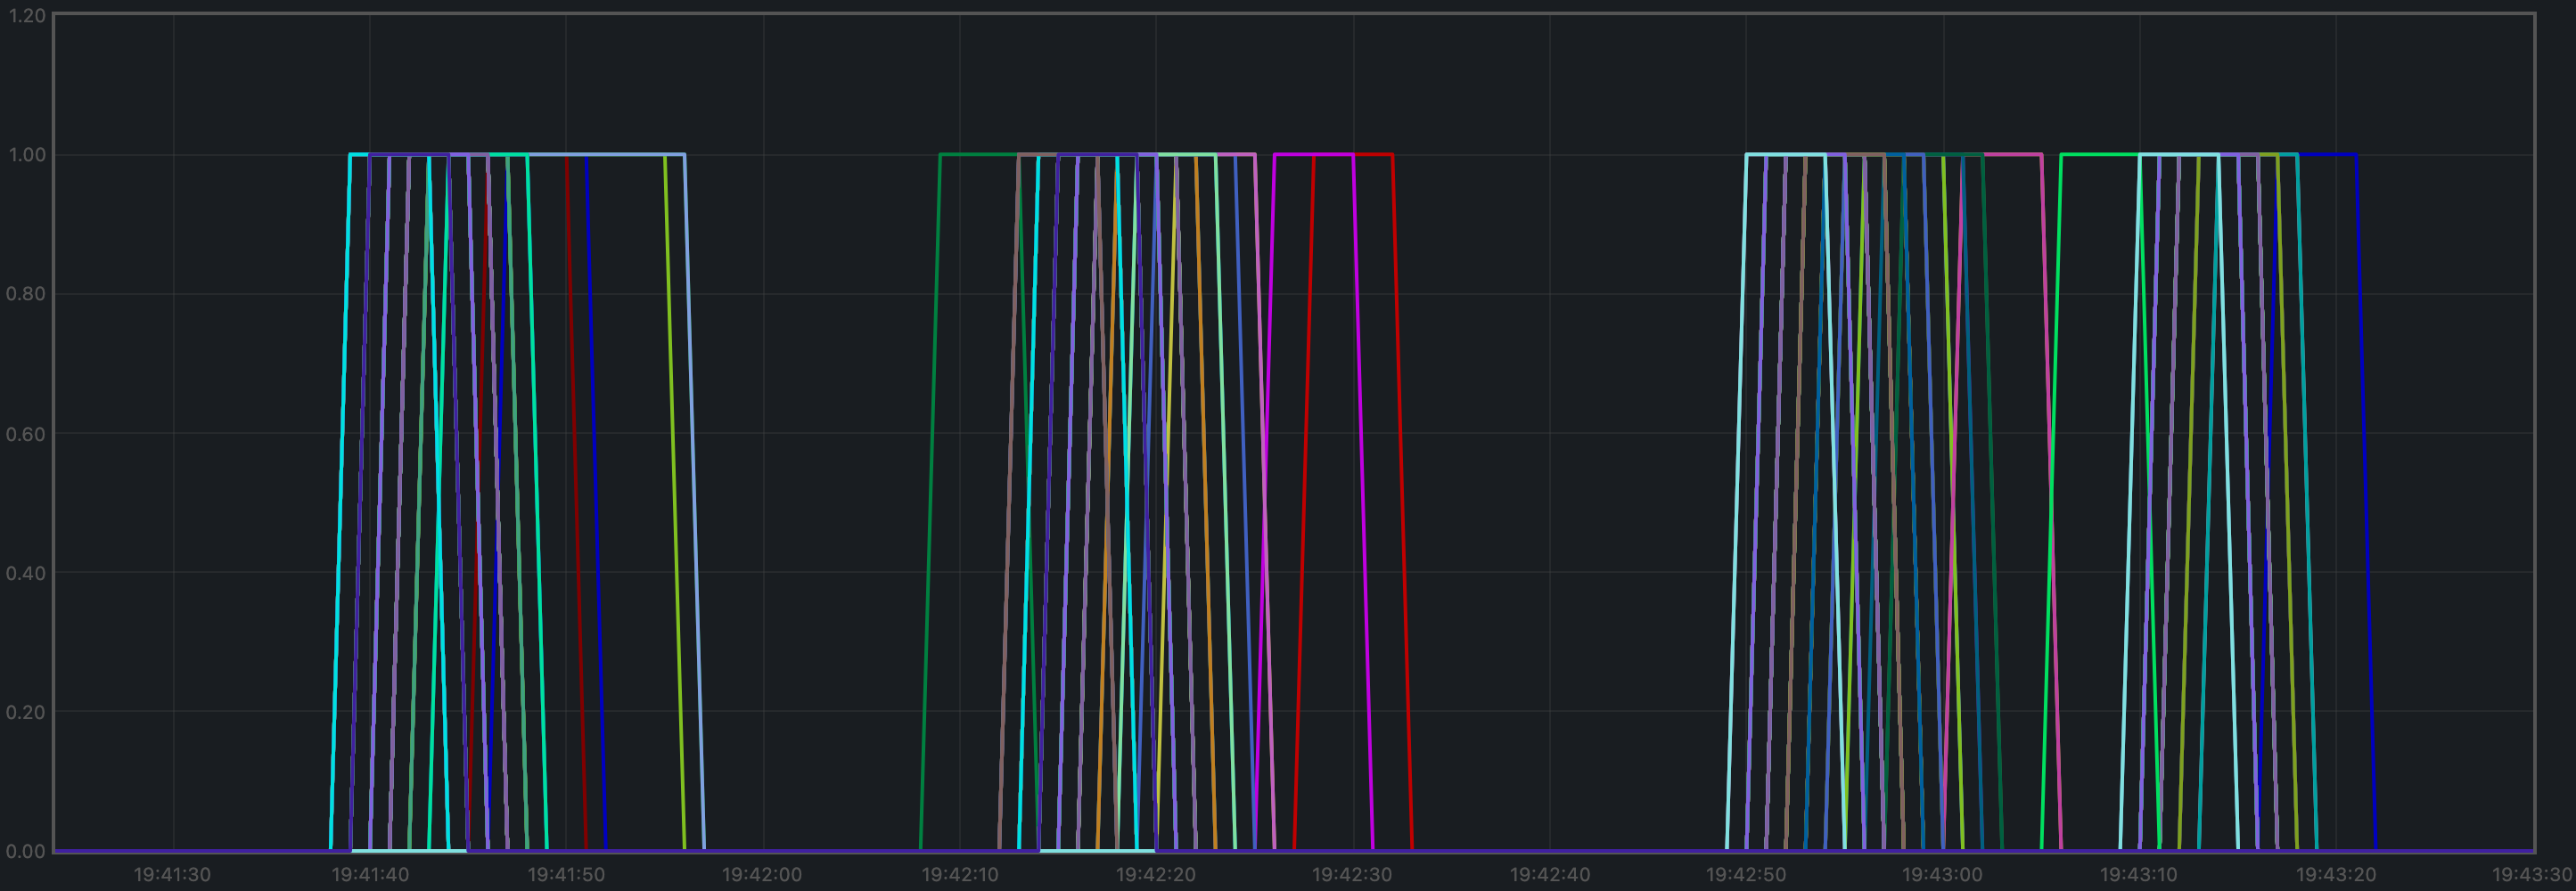
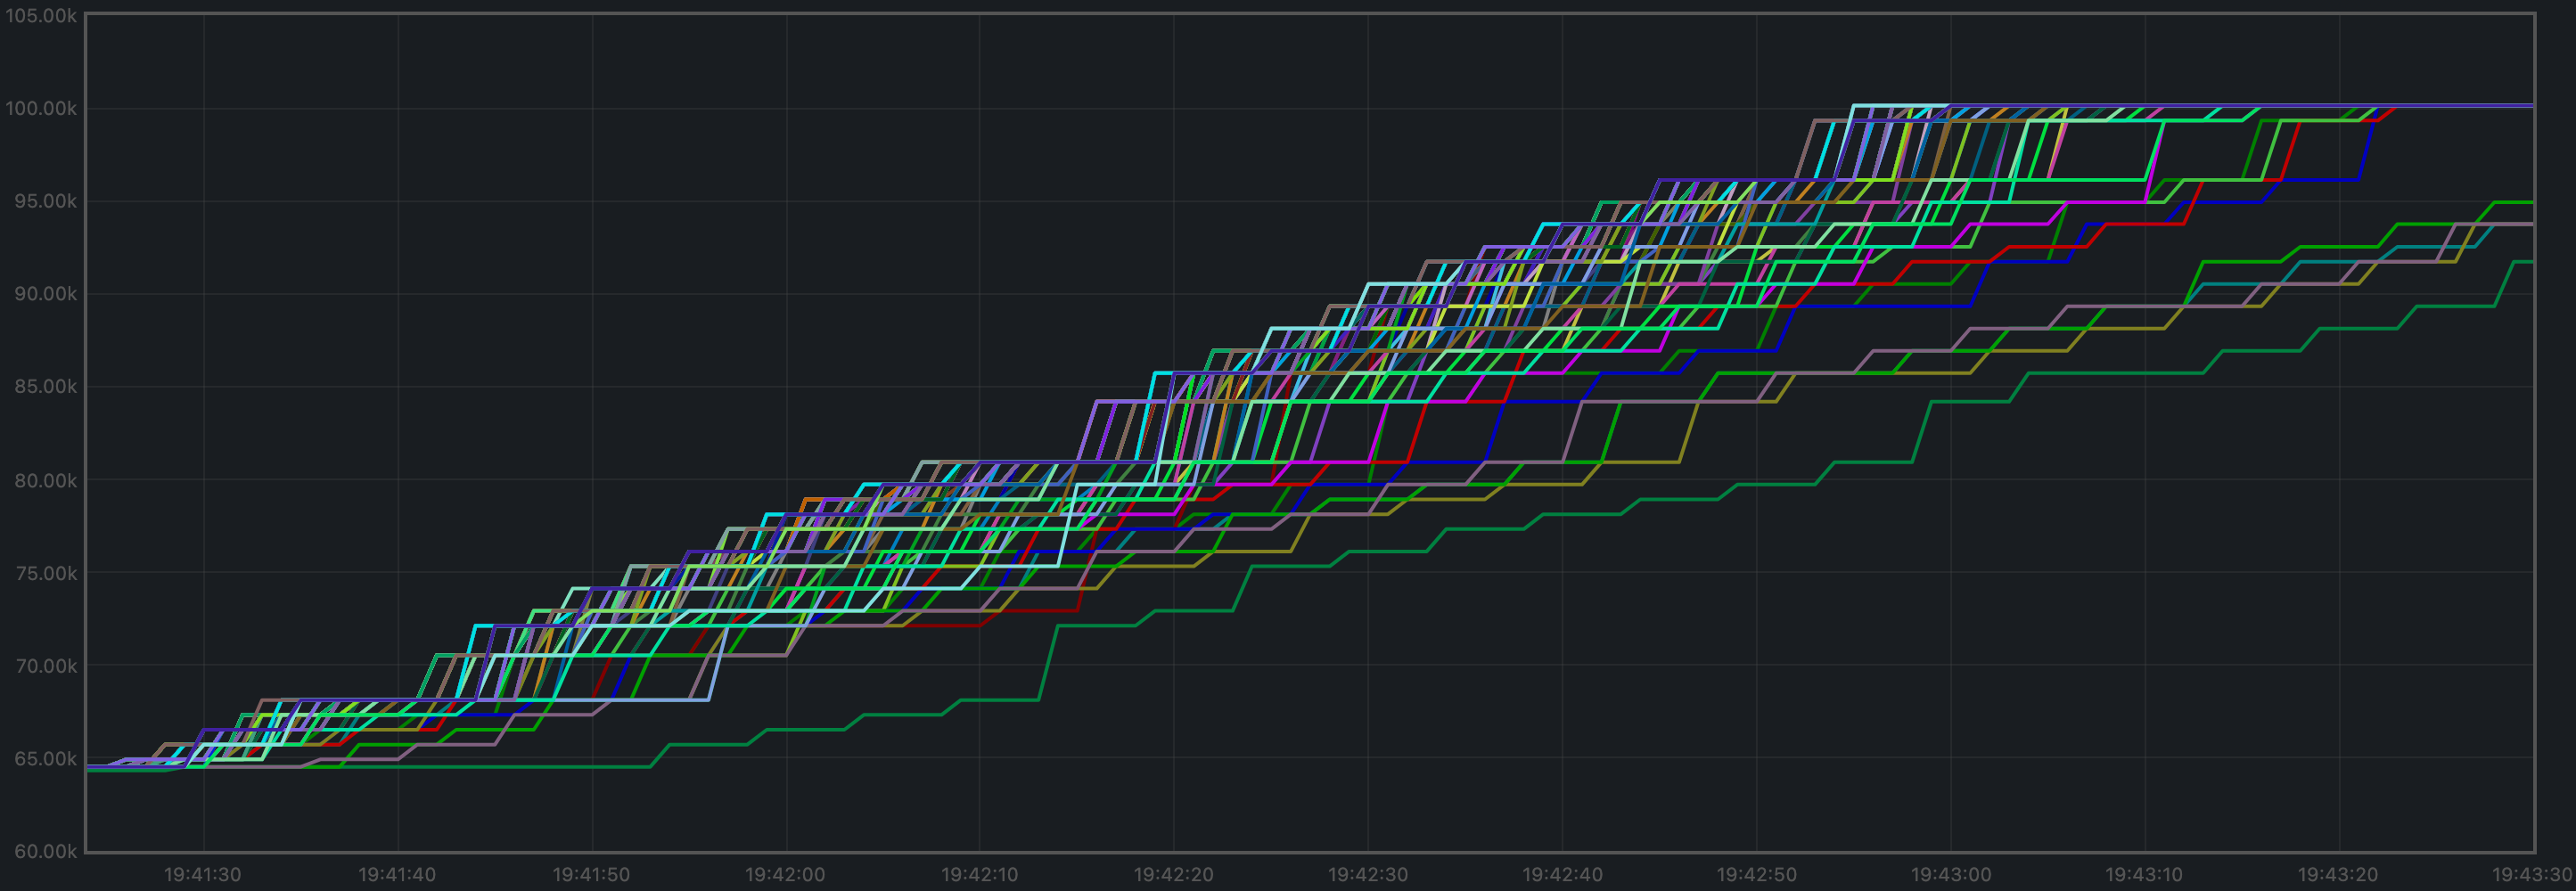
Blocks Produced per Minute, Transactions Processed per Minute
The blocks produced per minute are the slope of this plot.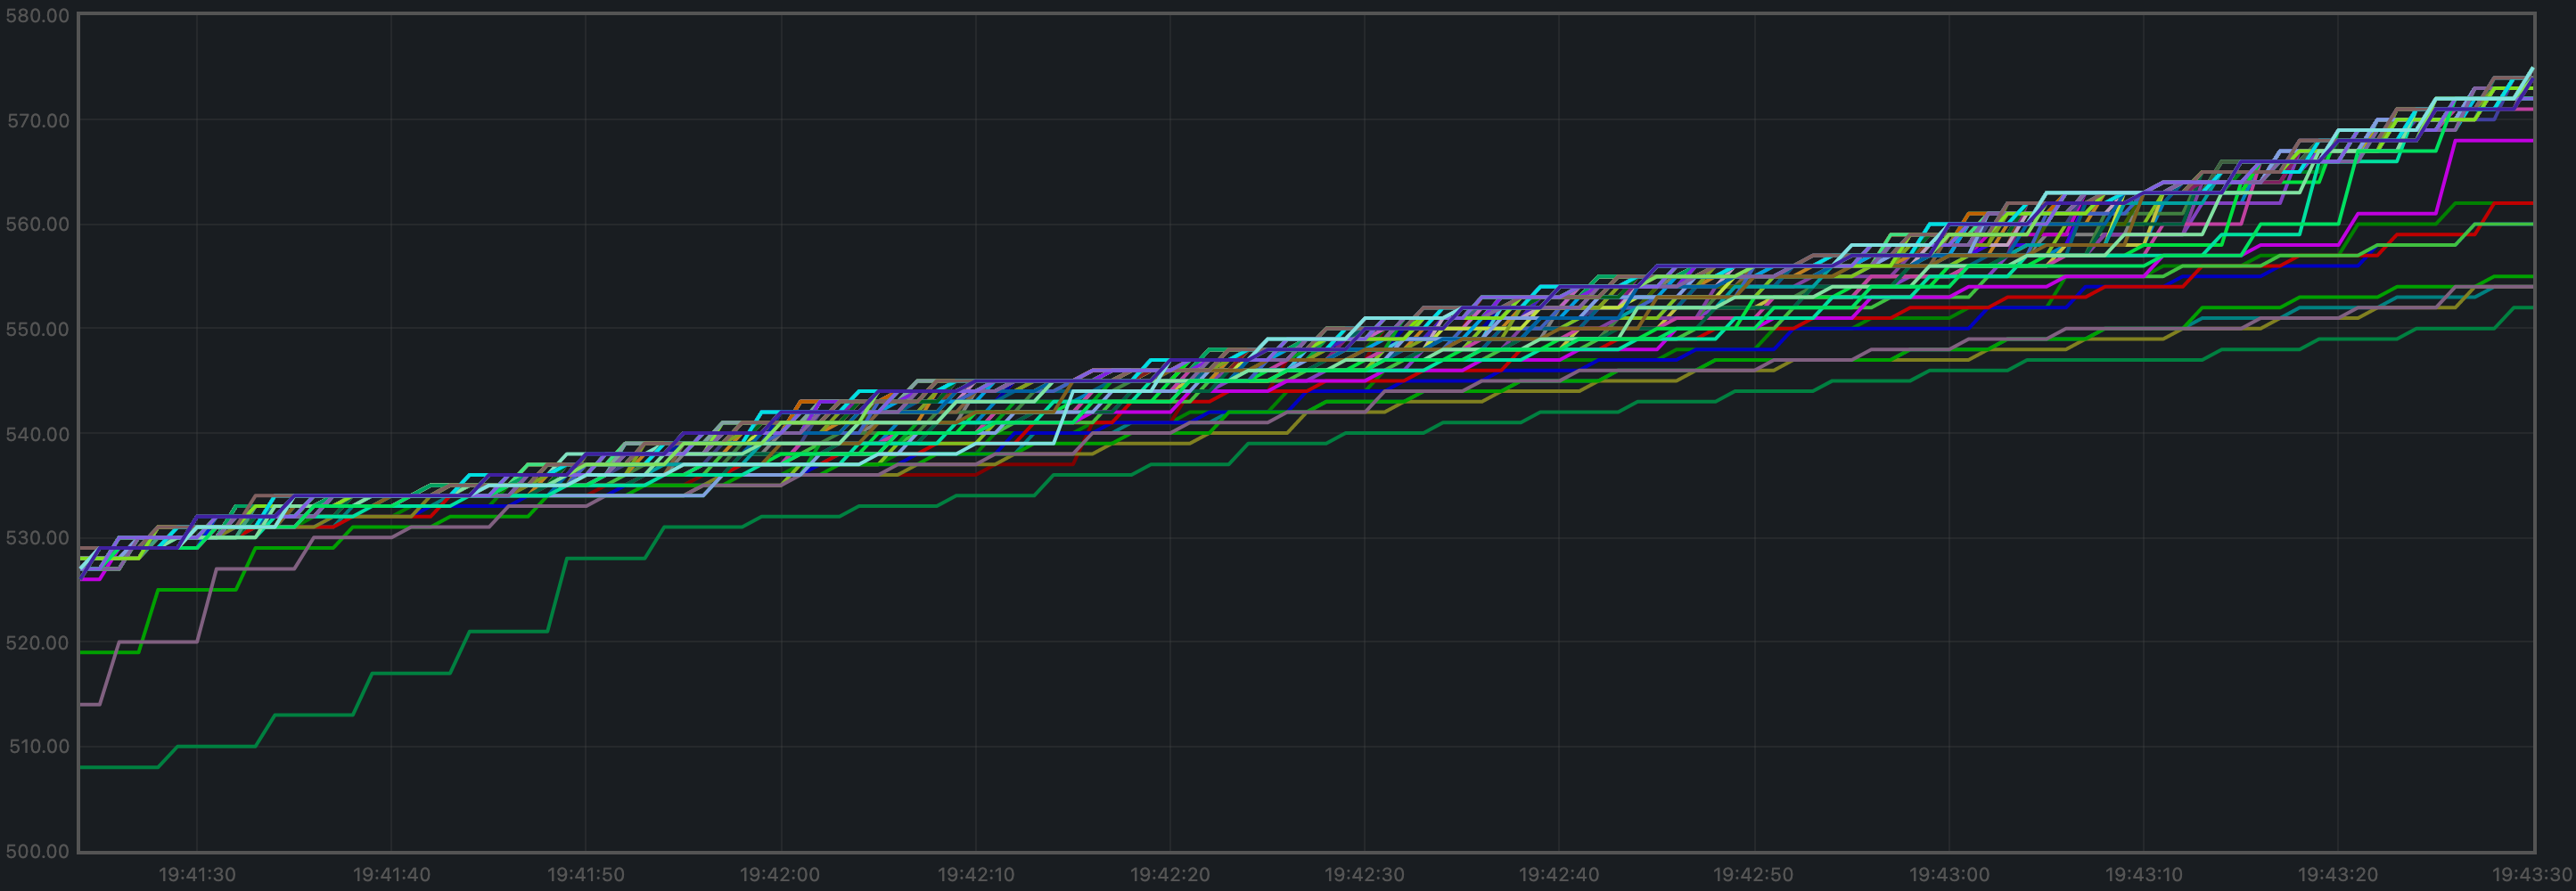
Memory Resident Set Size
Resident Set Size of all monitored processes is plotted below.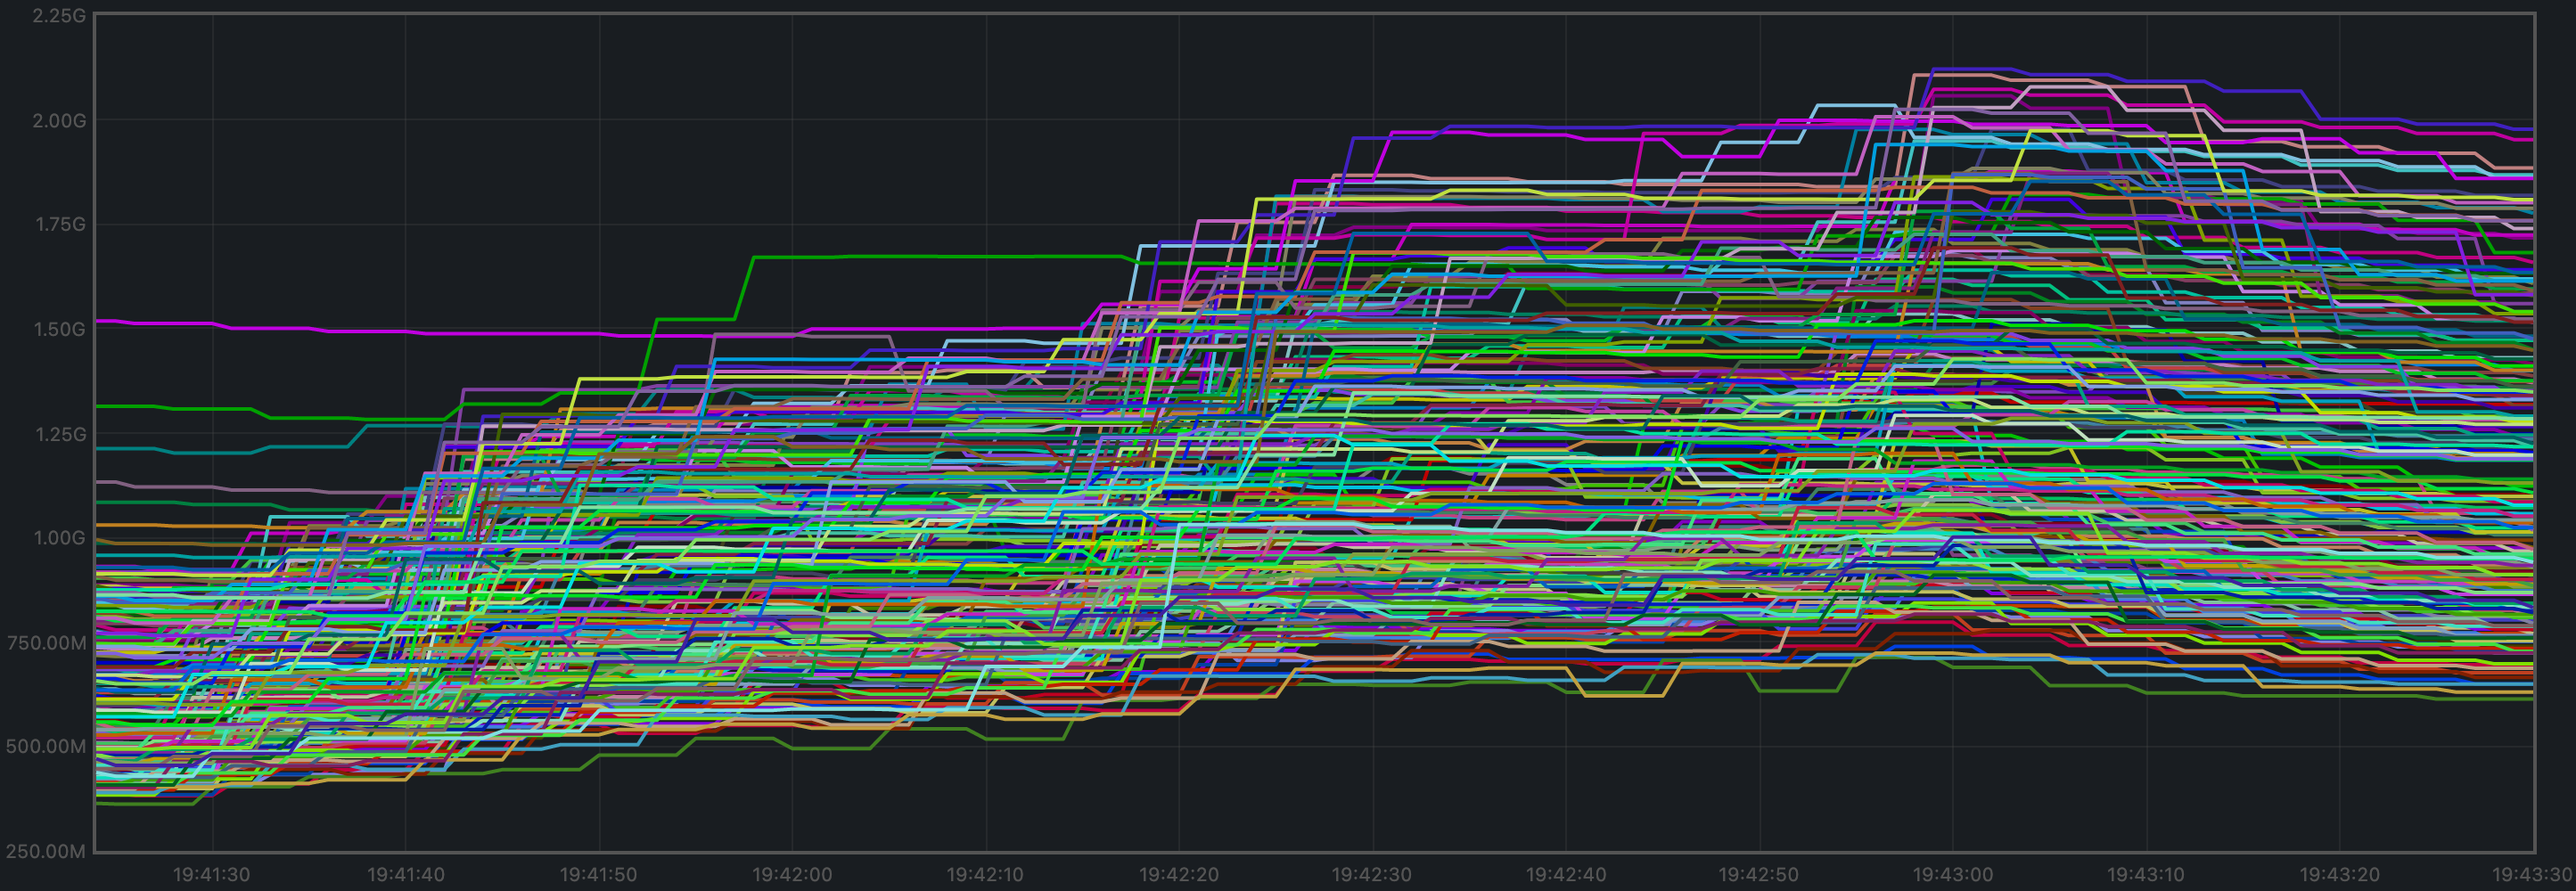
CPU Utilization
The best metric from Prometheus to gauge CPU utilization on a Unix machine isload1,
as it usually appears in the
output of top.
Test Result
Result: N/A (v0.34.x is the baseline) Date: 2022-10-14 Version: 3ec6e424d6ae4c96867c2dcf8310572156068bb6Rotating Node Testnet
For this testnet, we will use a load that can safely be considered below the saturation point for the size of this testnet (between 13 and 38 full nodes):c=4,r=800.
N.B.: The version of CometBFT used for these tests is affected by #9539.
However, the reduced load that reaches the mempools is orthogonal to the functionality
we are focusing on here.
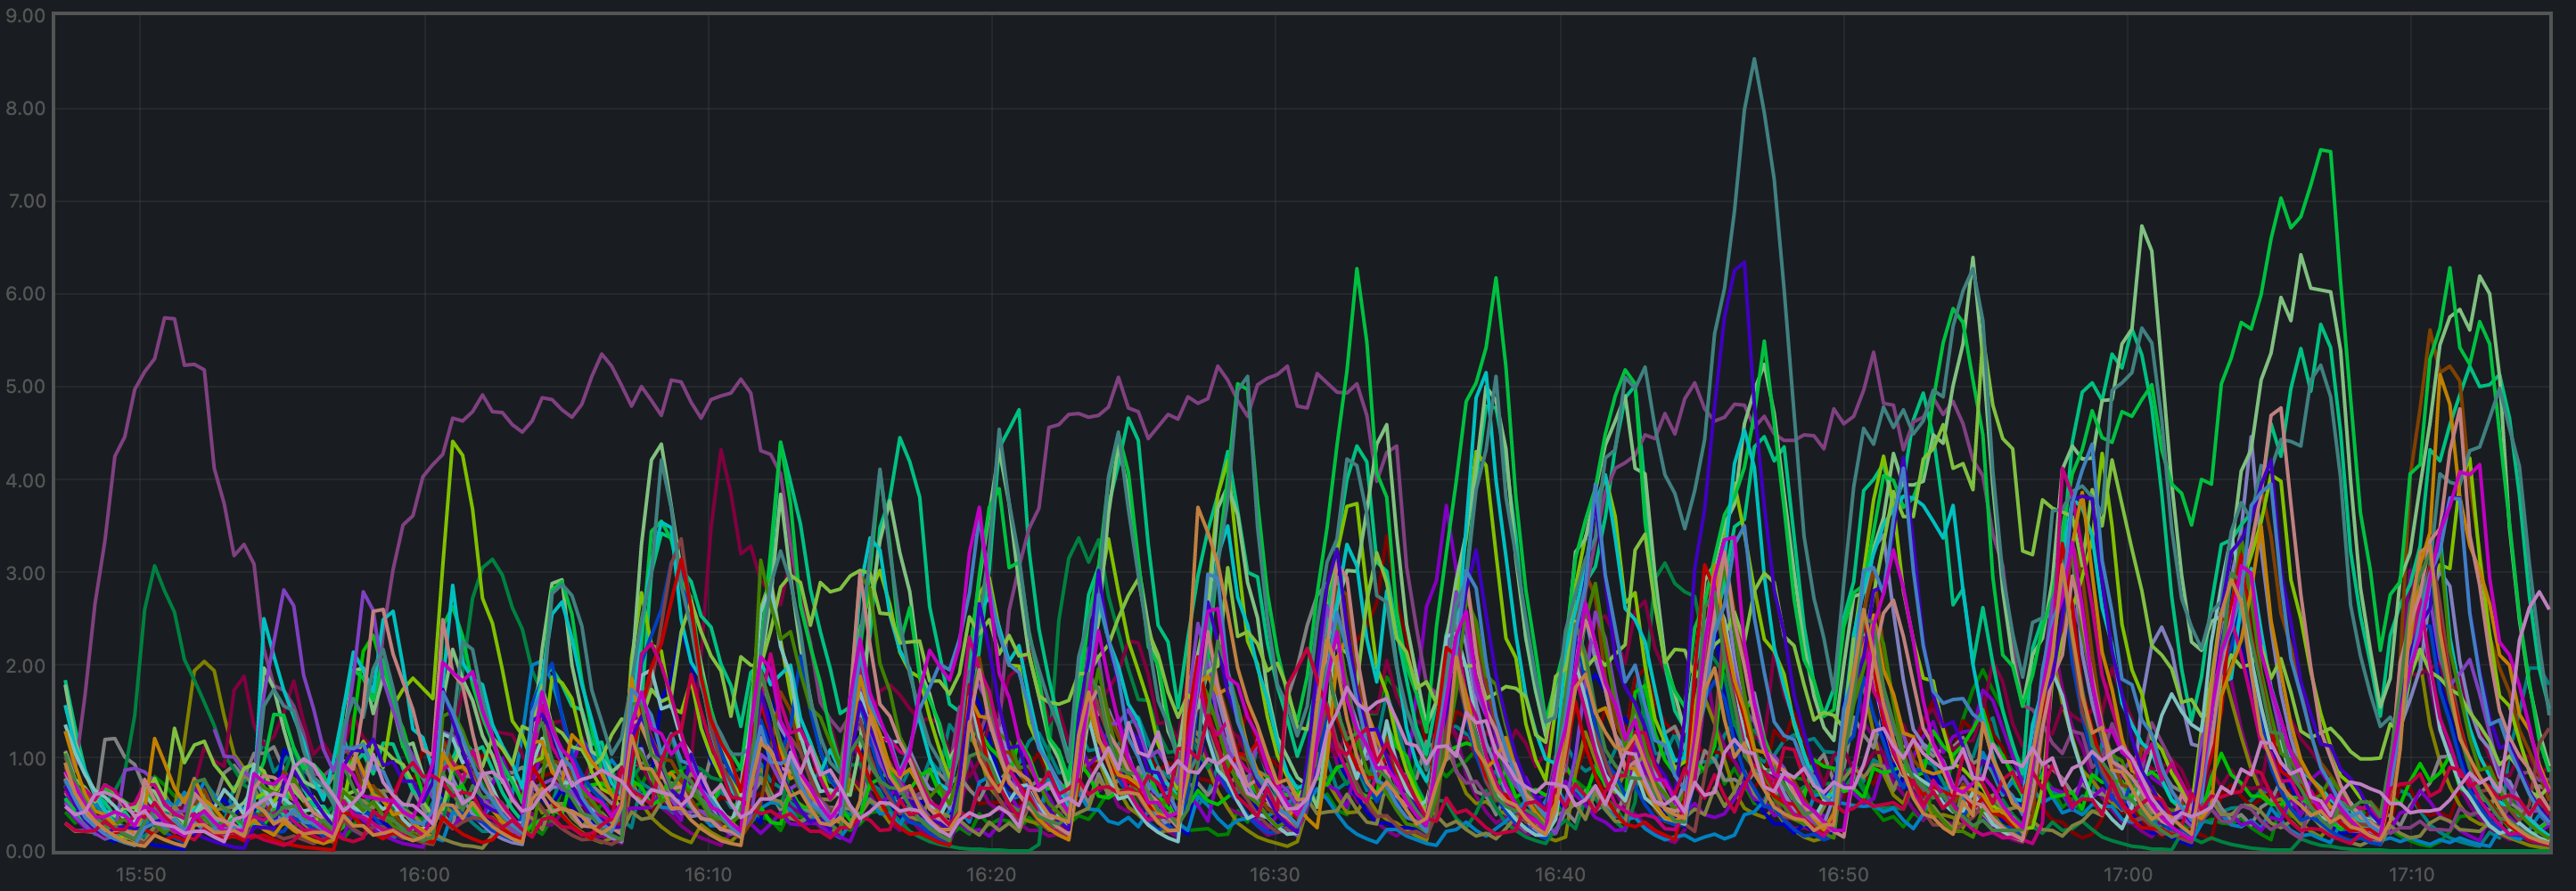
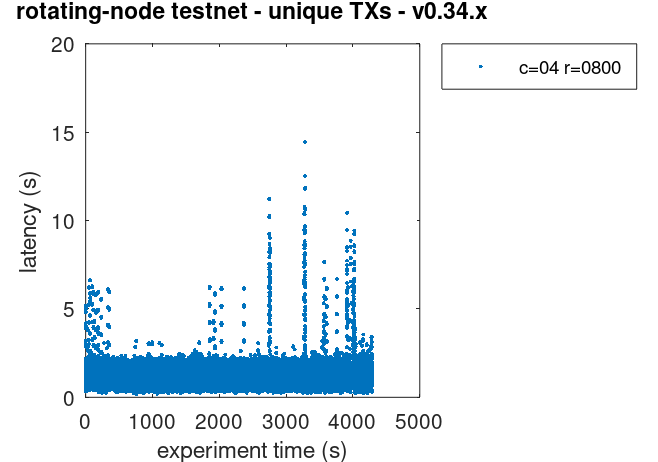
Latencies
The plot of all latencies can be seen in the following plot.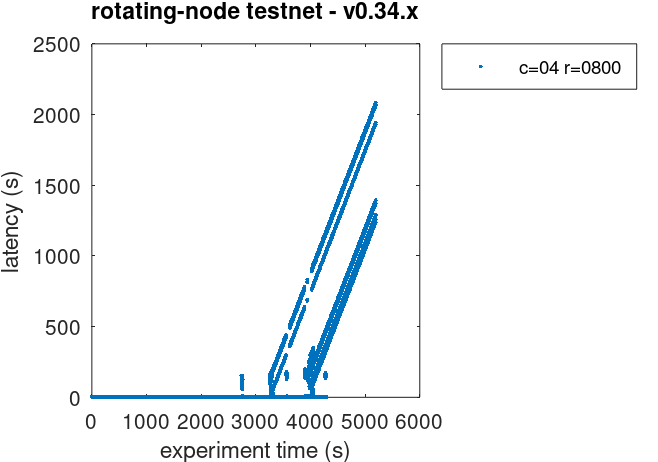
v0.34.x, will need to be addressed, perhaps in the same way
we addressed it when running the 200 node test with high loads: increasing the cache_size
configuration parameter.
Prometheus Metrics
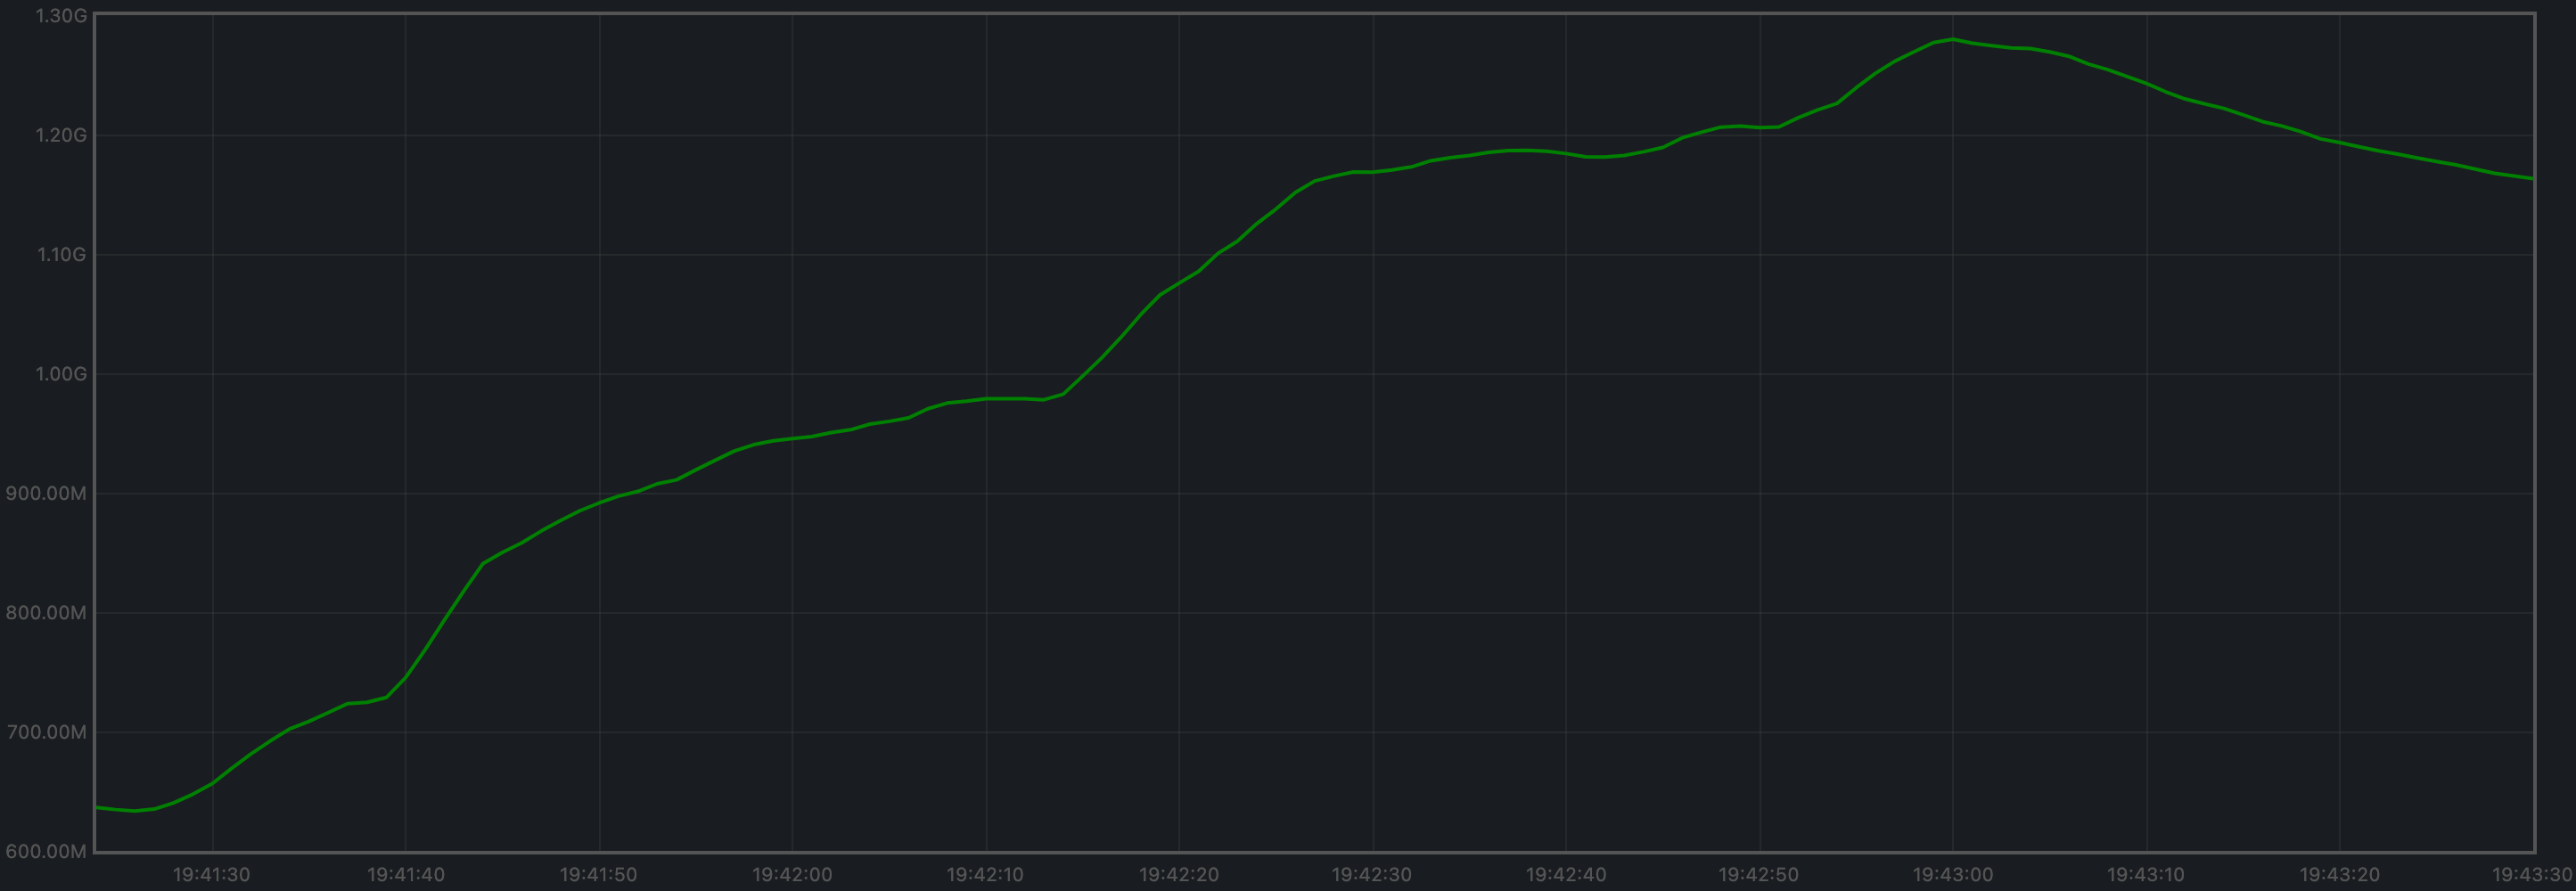
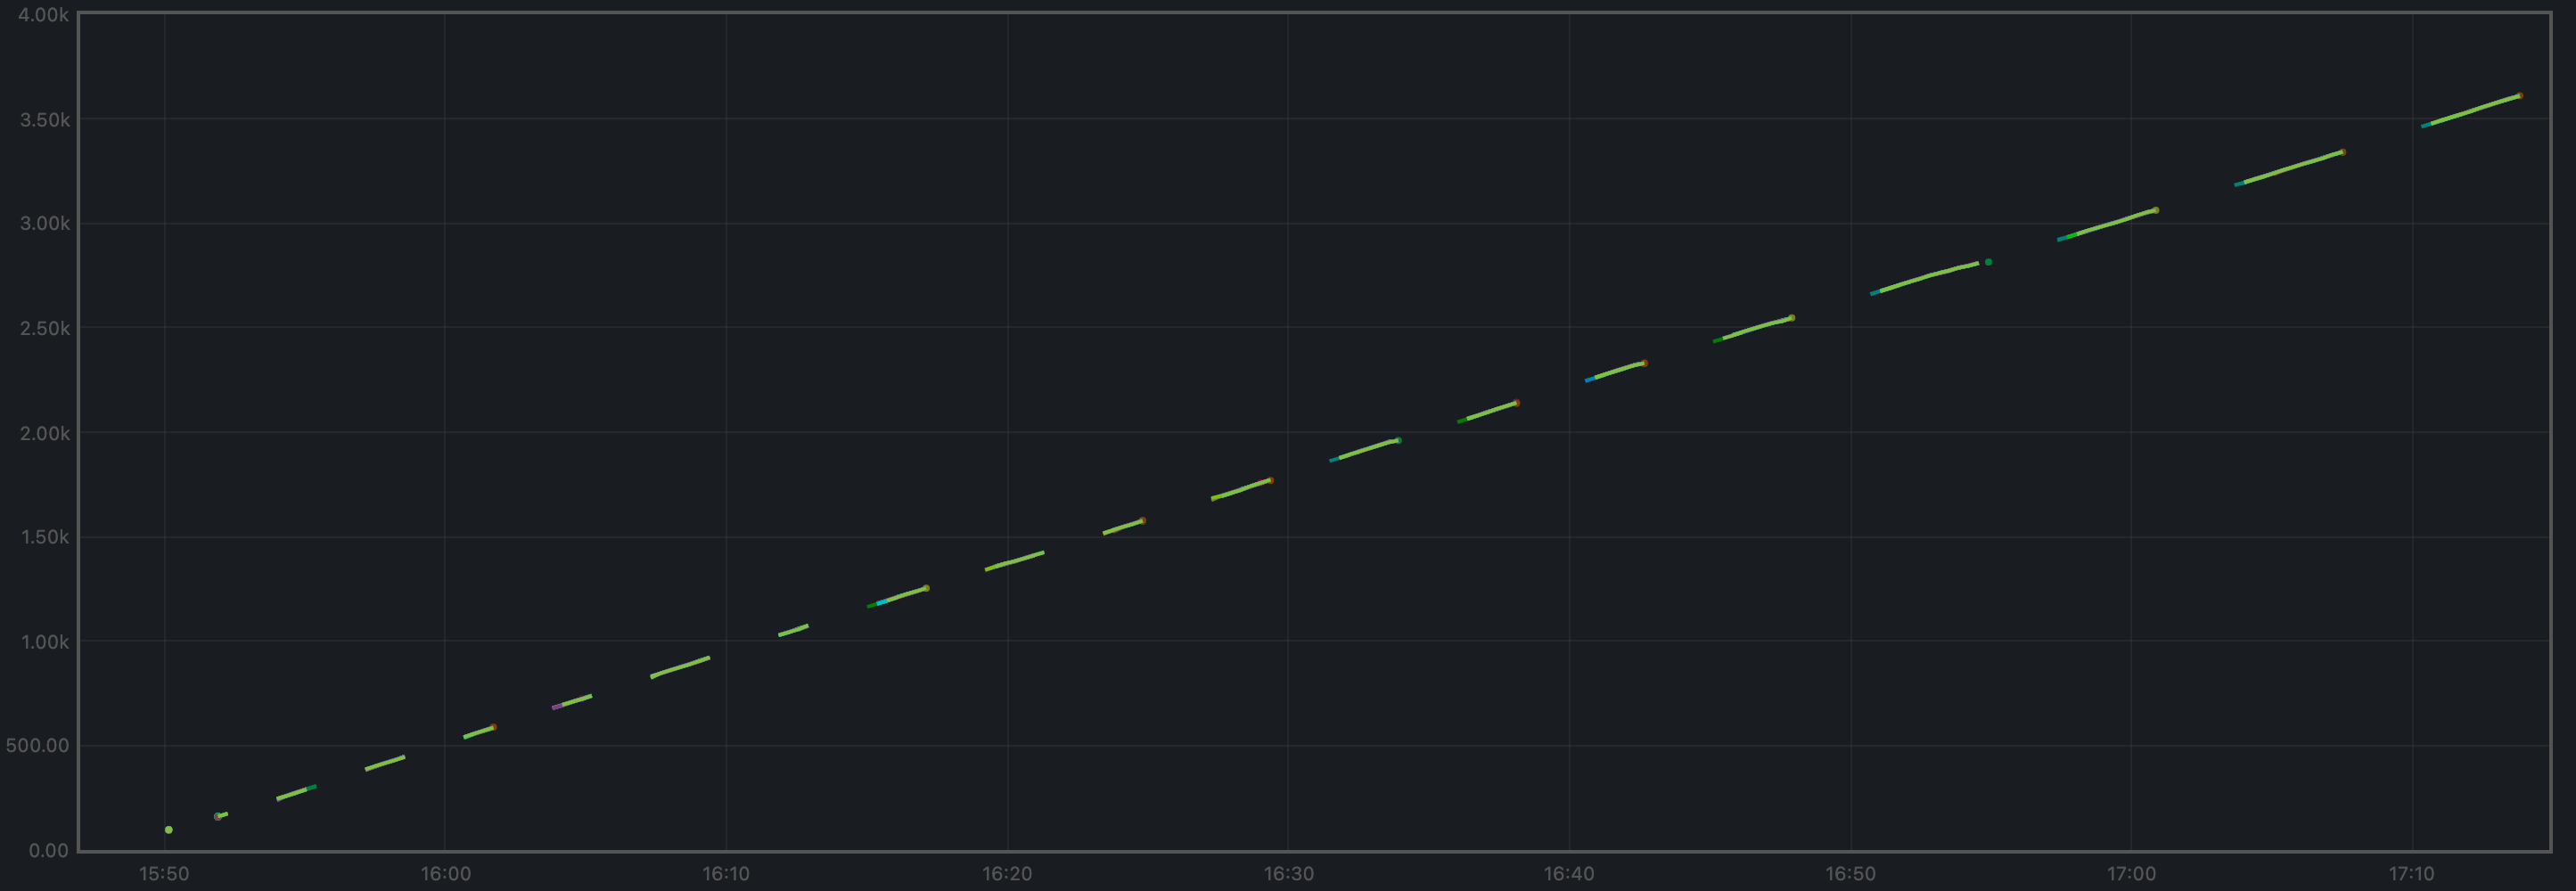
The set of metrics shown here are fewer than for the 200 node experiment. We are only interested in those for which the catch-up process (blocksync) may have an impact.Blocks and Transactions per Minute
Just as shown for the 200 node test, the blocks produced per minute are the gradient of this plot.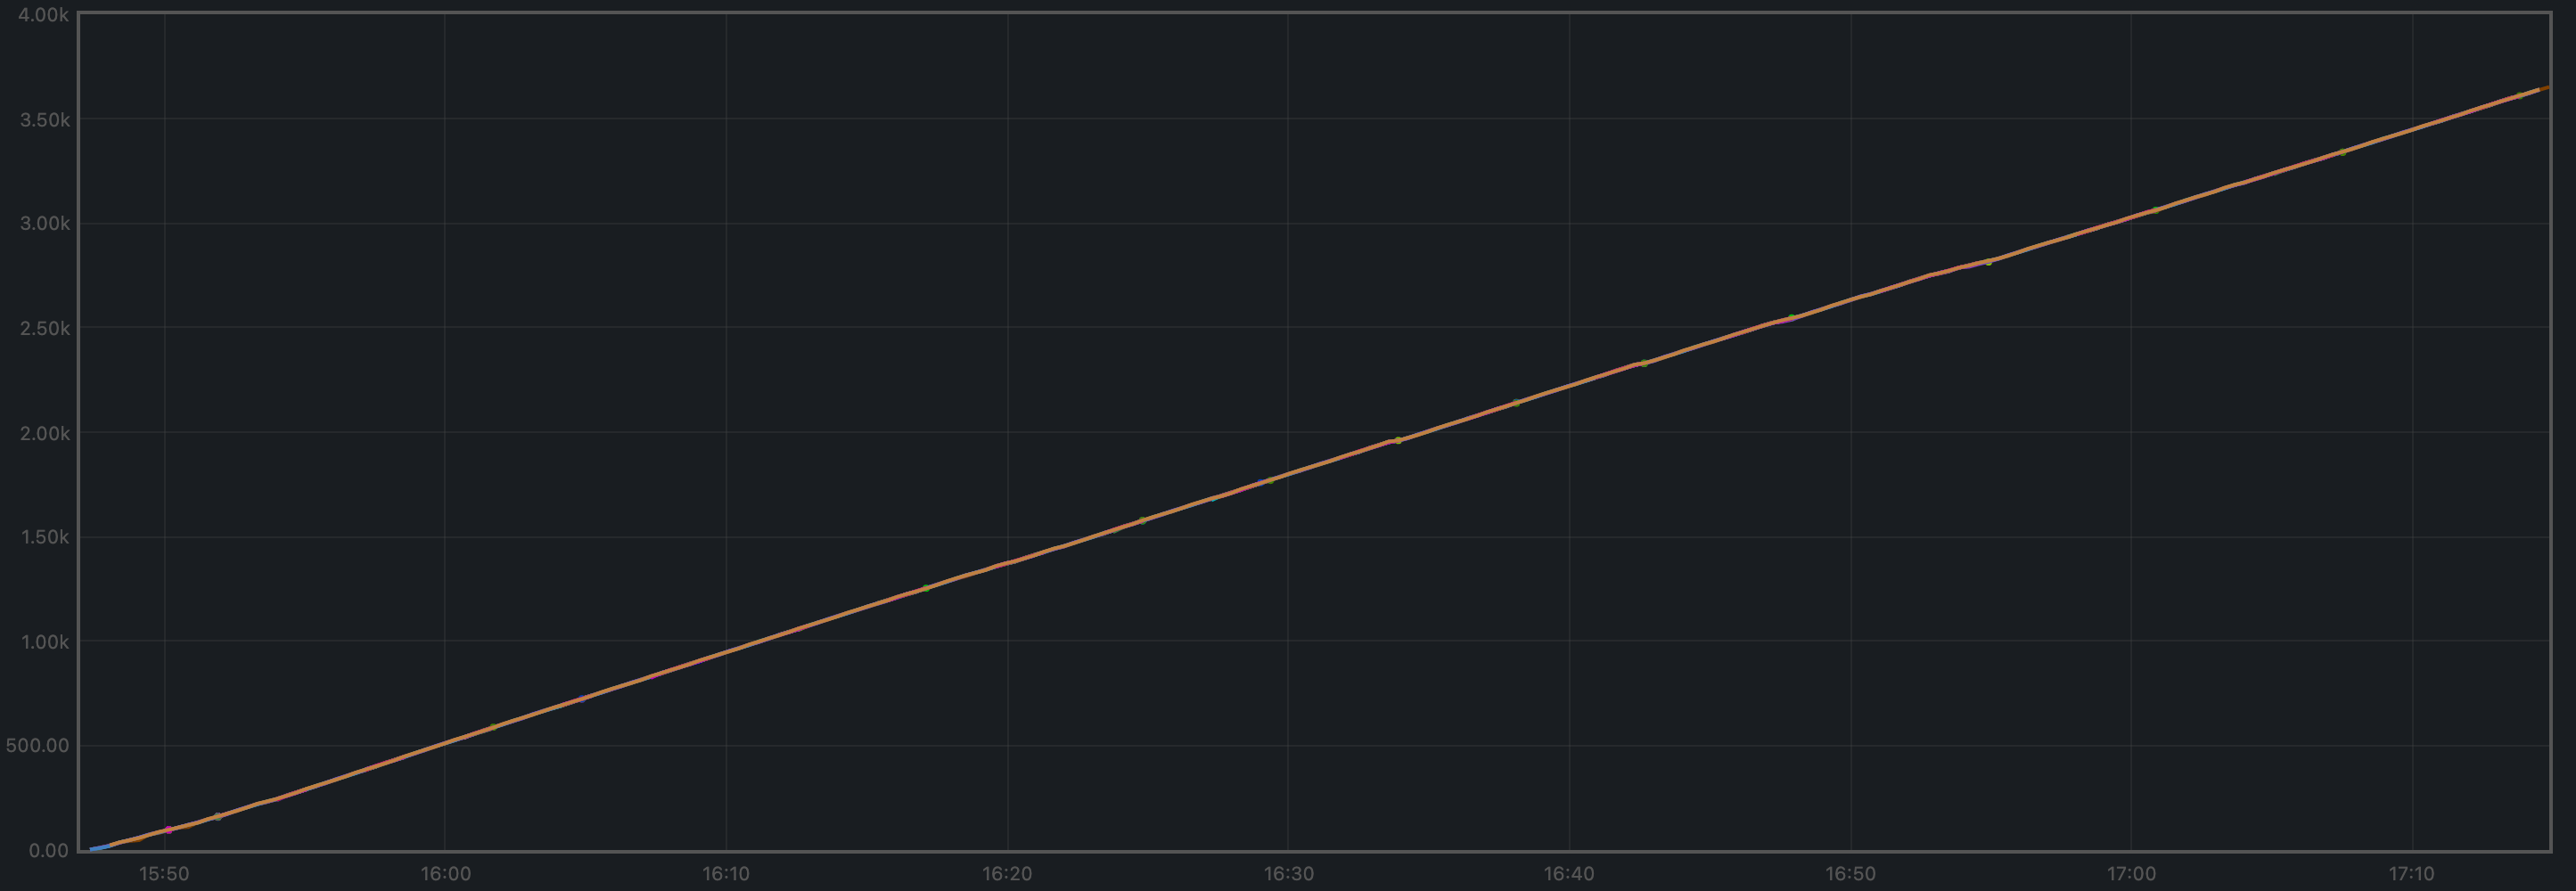
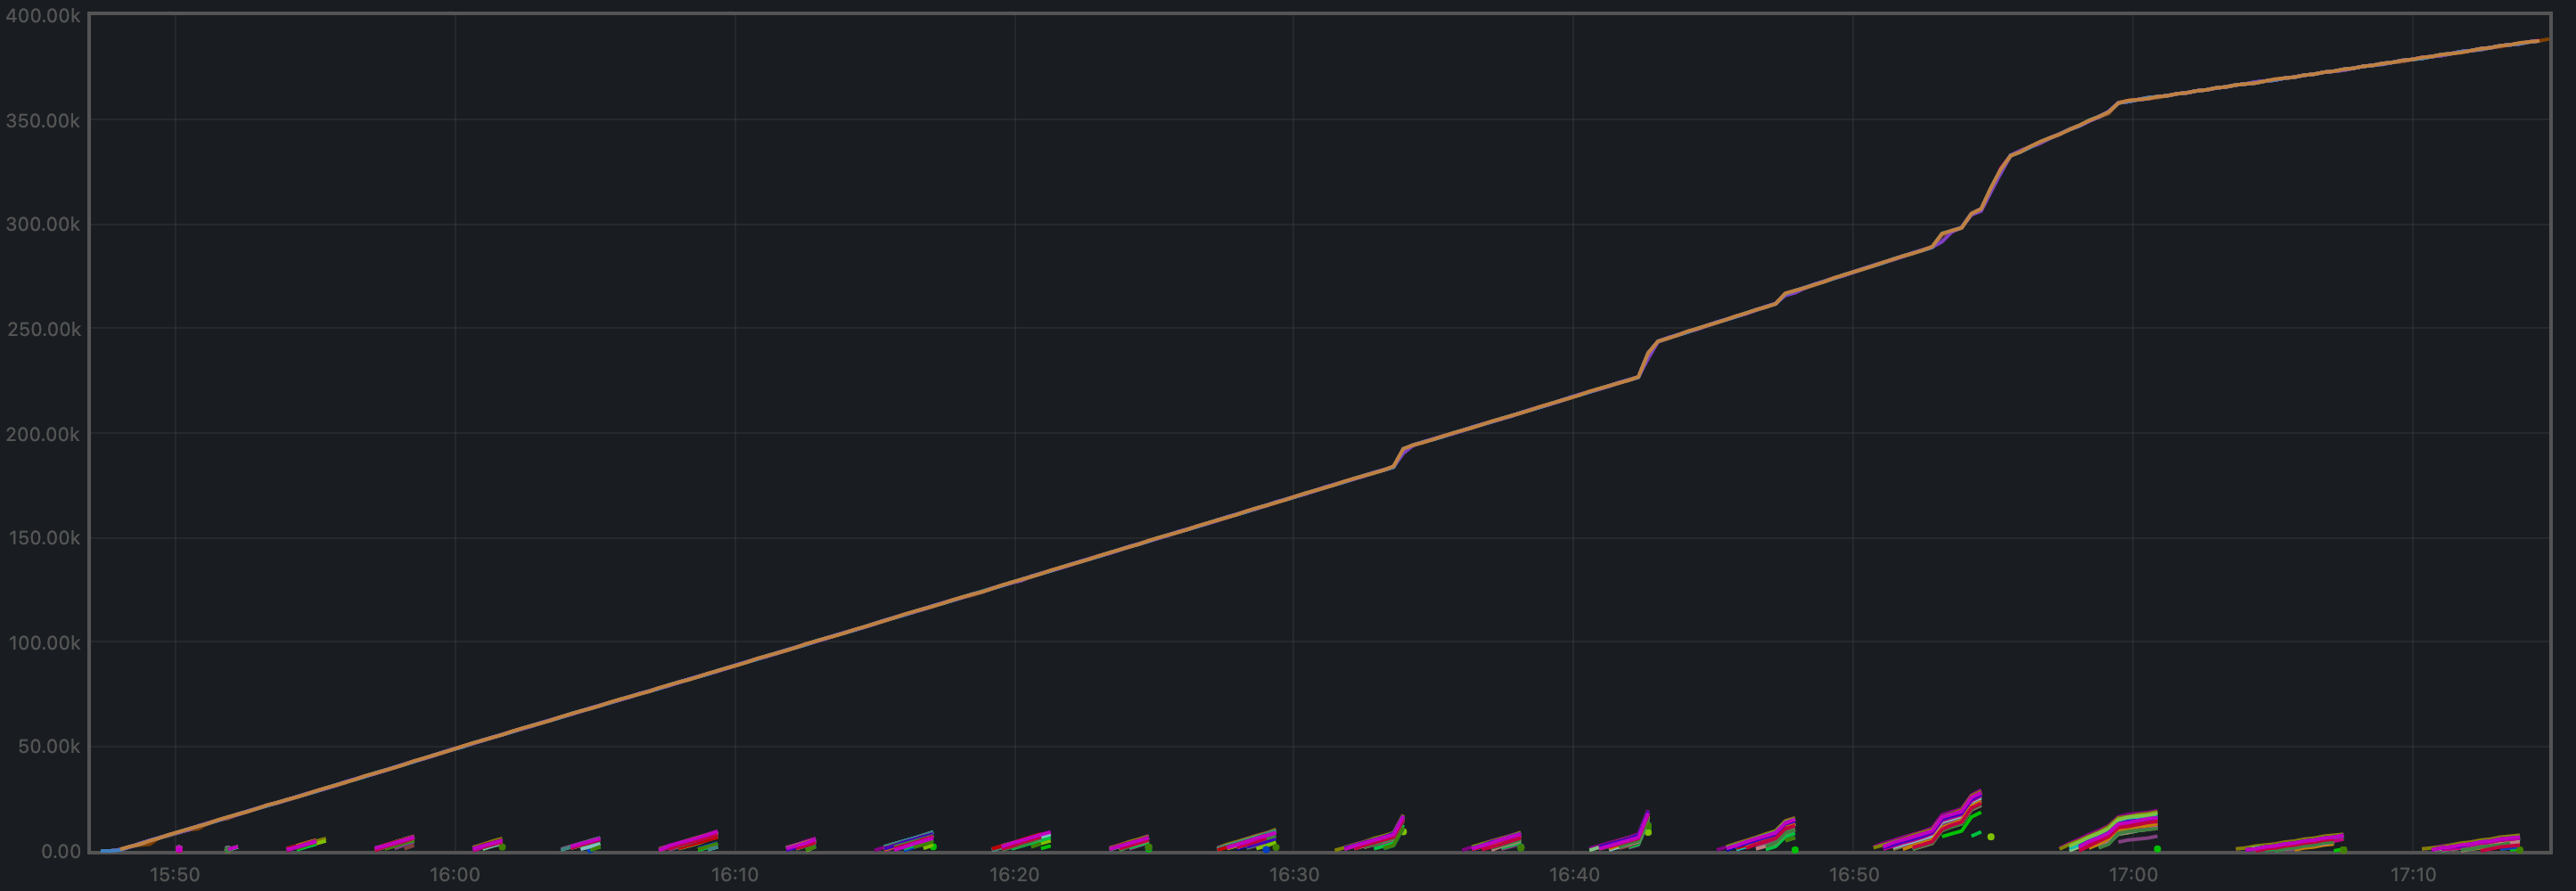
y=0 are the transactions that
ephemeral nodes start processing when they are caught up.
Over a period of 5229 seconds, the total goes from 0 to 387697 transactions,
resulting in 4449 transactions per minute. We can see some abrupt changes in
the plot’s gradient. This will need to be investigated.
Peers
The plot below shows the evolution in peers throughout the experiment. The periodic changes observed are due to the ephemeral nodes being stopped, wiped out, and recreated.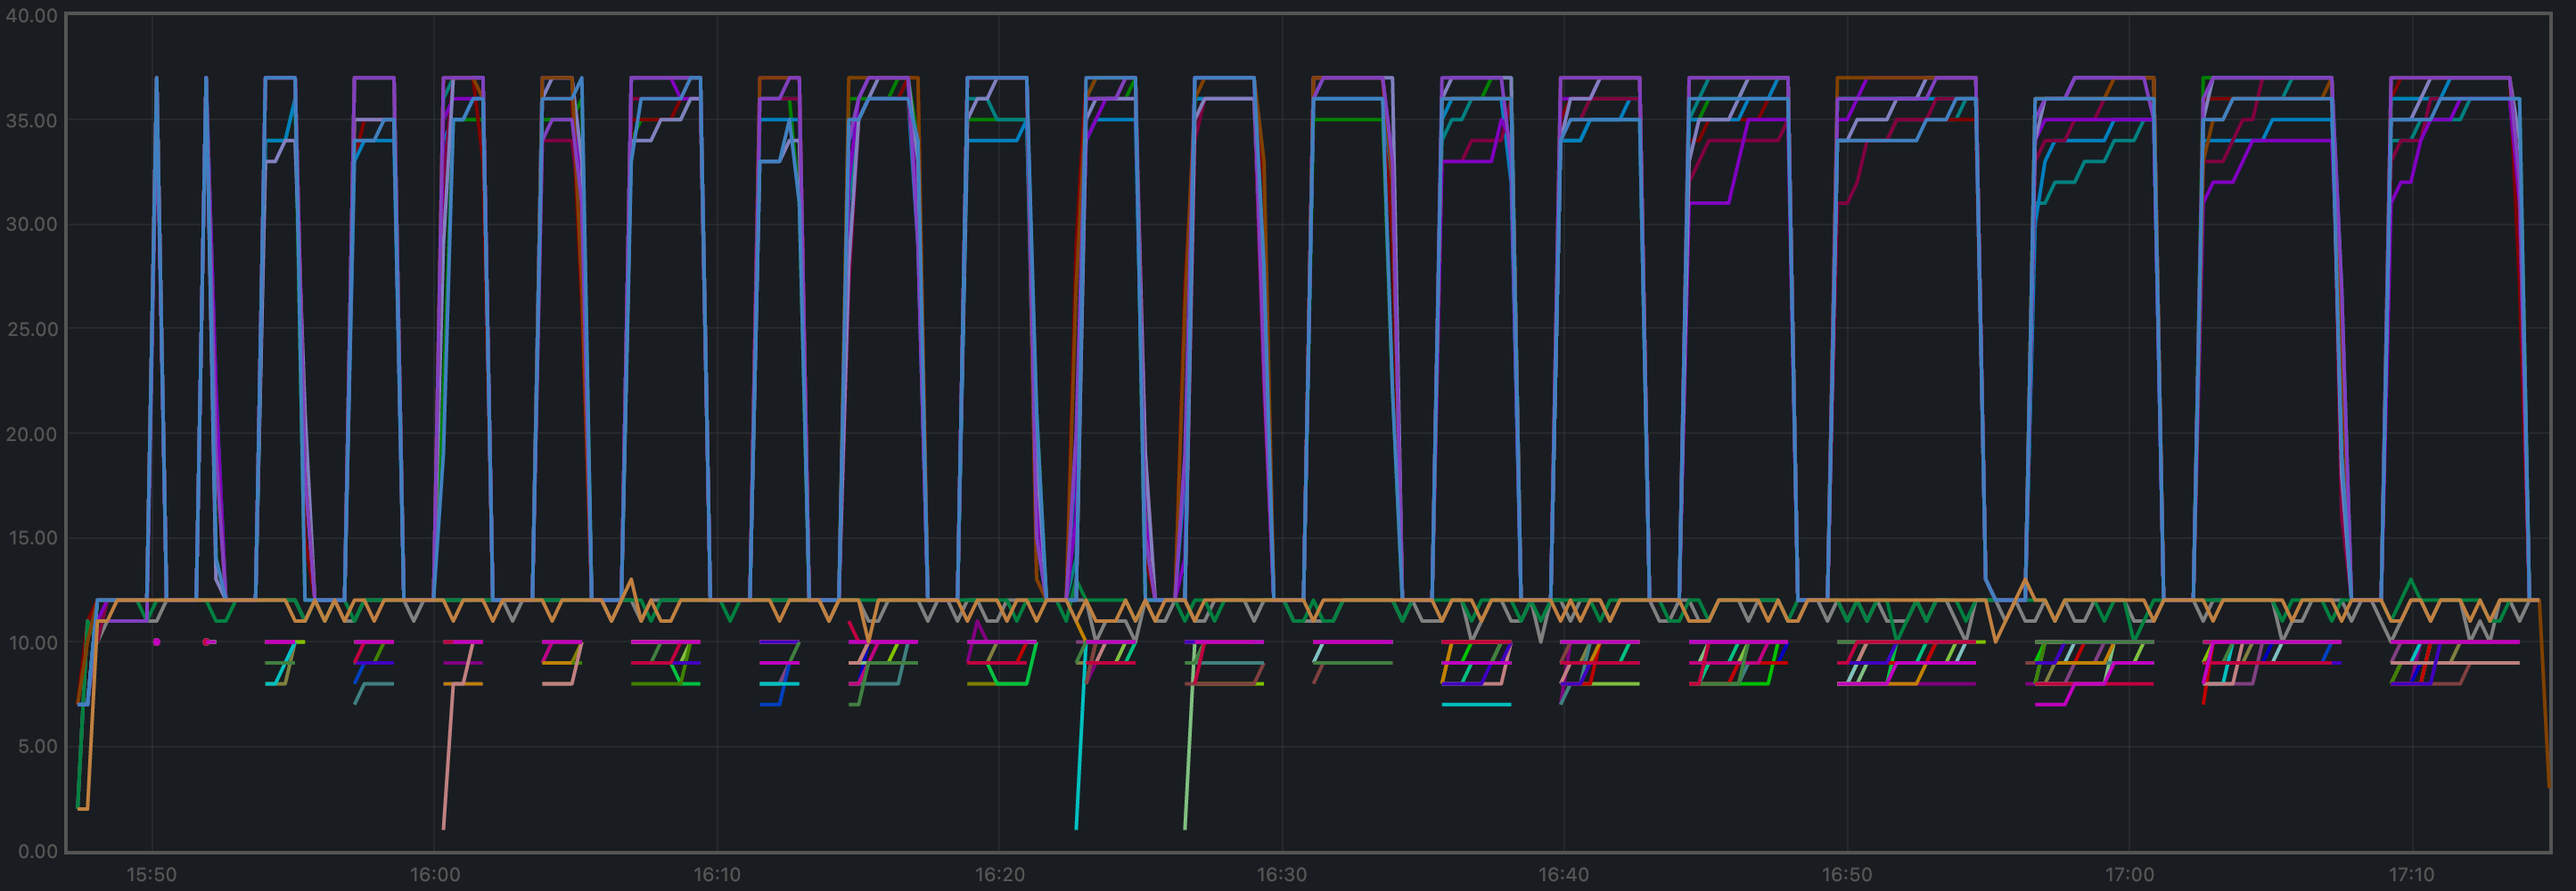
Memory Resident Set Size
The average Resident Set Size (RSS) over all processes seems stable and slightly growing toward the end. This might be related to the increase in transaction load observed above.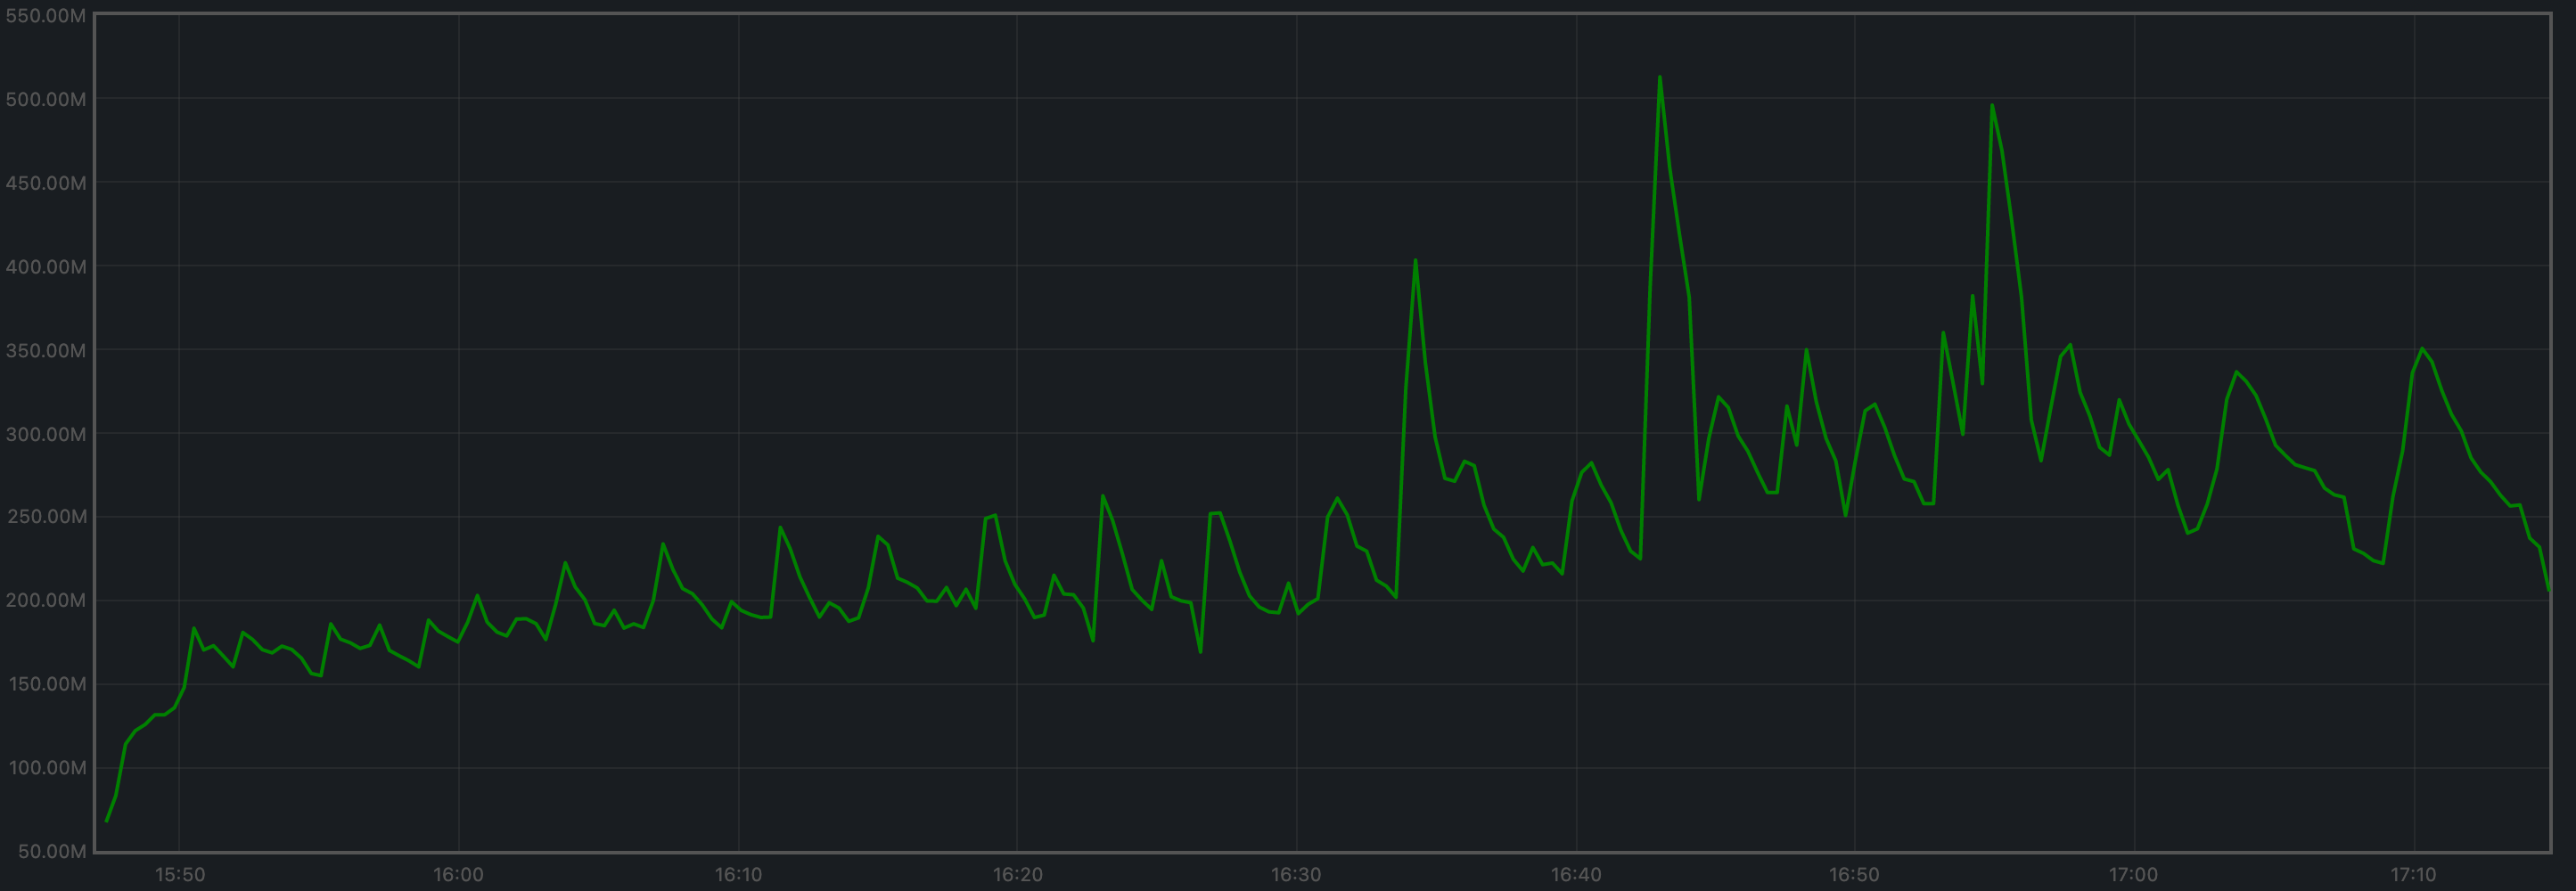
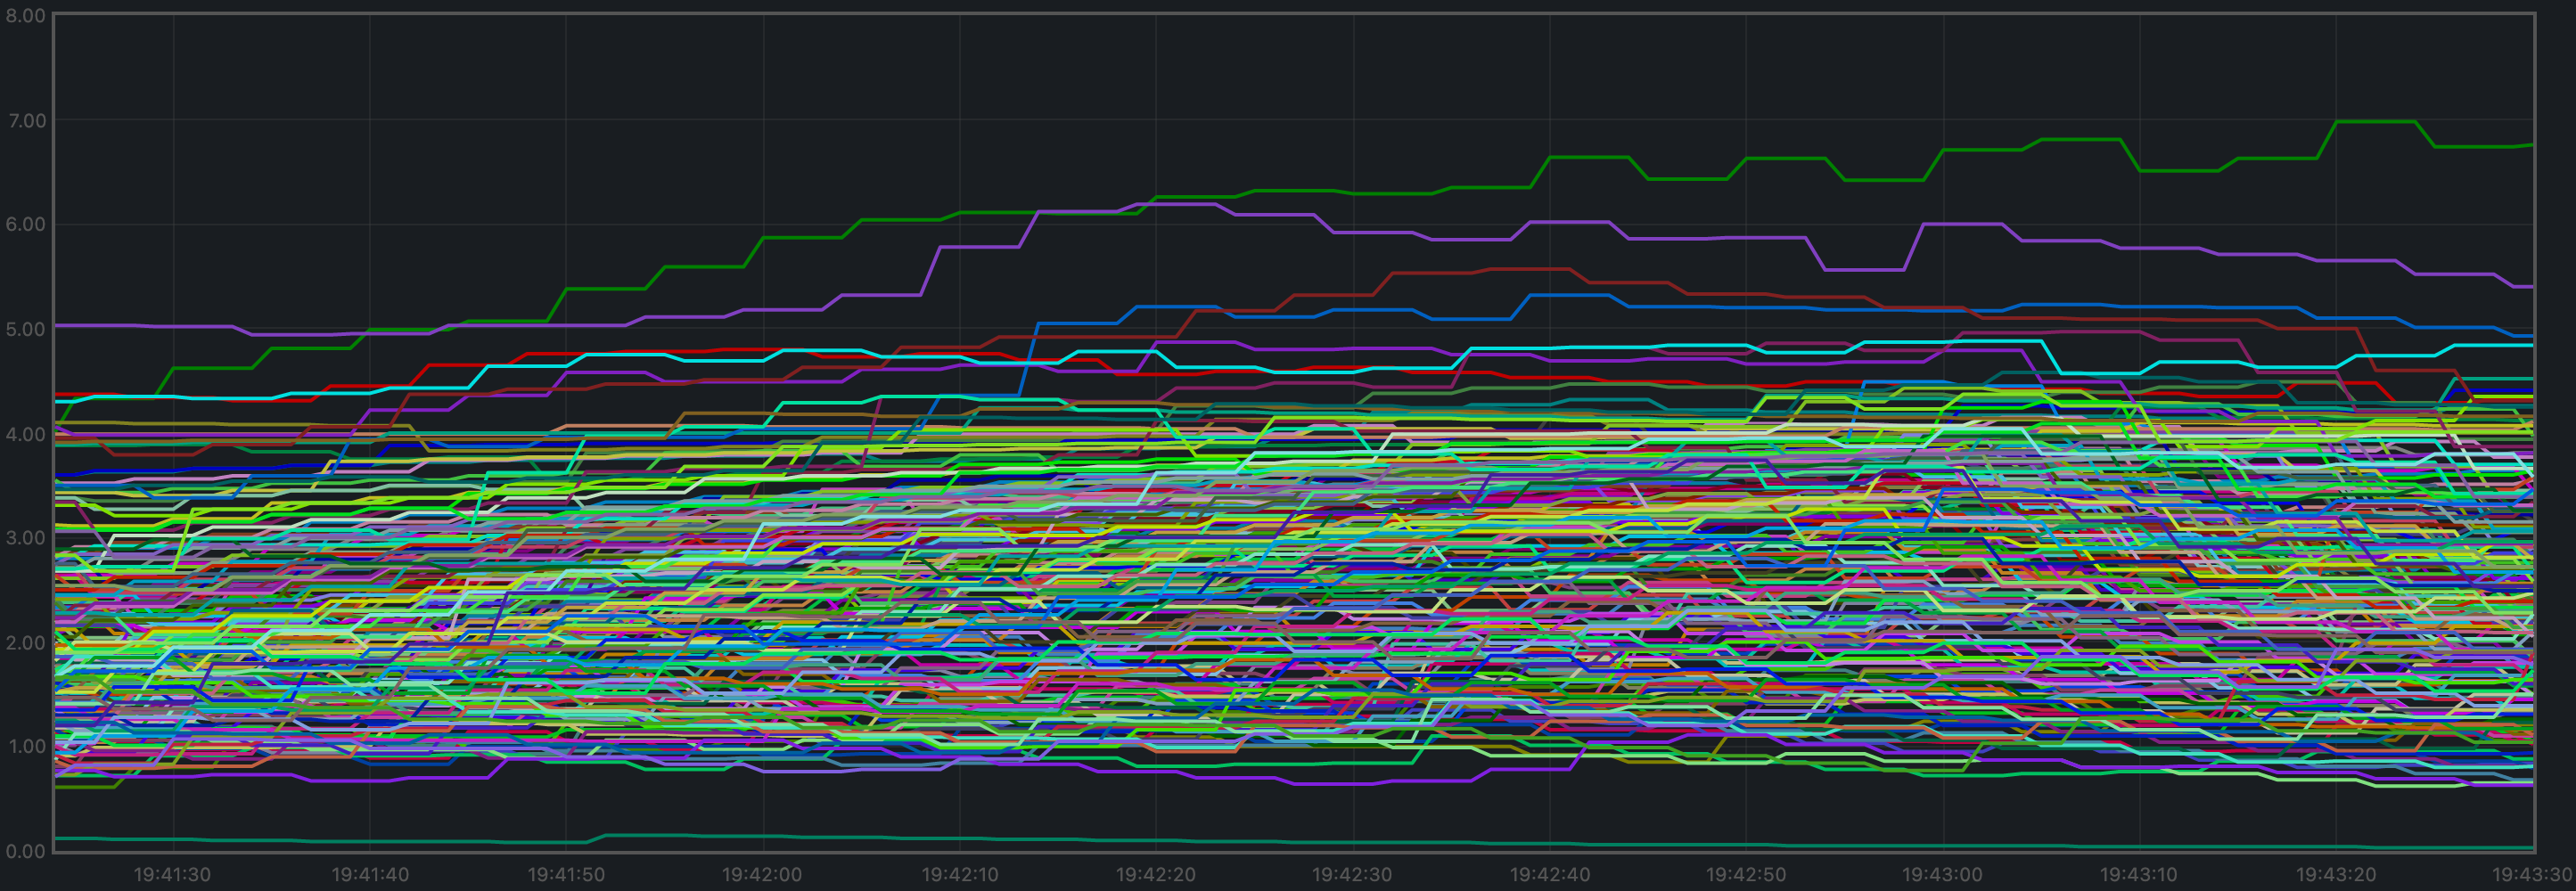
CPU Utilization
The plot shows metricload1 for all nodes.