

Tendermint Core QA Results v0.37.x
Issues Discovered
During this iteration of the QA process, the following issues were found:- (critical, fixed) #9533 - This bug caused full nodes to sometimes get stuck when blocksyncing, requiring a manual restart to unblock them. Importantly, this bug was also present in v0.34.x and the fix was also backported in #9534.
- (critical, fixed) #9539 -
loadtimeis very likely to include more than one ”=” character in transactions, which is rejected by the e2e application. - (critical, fixed) #9581 - Absent prometheus label makes CometBFT crash when enabling Prometheus metric collection.
- (non-critical, not fixed) #9548 - Full nodes can go over 50 connected peers, which is not intended by the default configuration.
- (non-critical, not fixed) #9537 - With the default mempool cache setting, duplicated transactions are not rejected when gossiped and eventually flood all mempools. The 200 node testnets were thus run with a value of 200000 (as opposed to the default 10000).
200 Node Testnet
Finding the Saturation Point
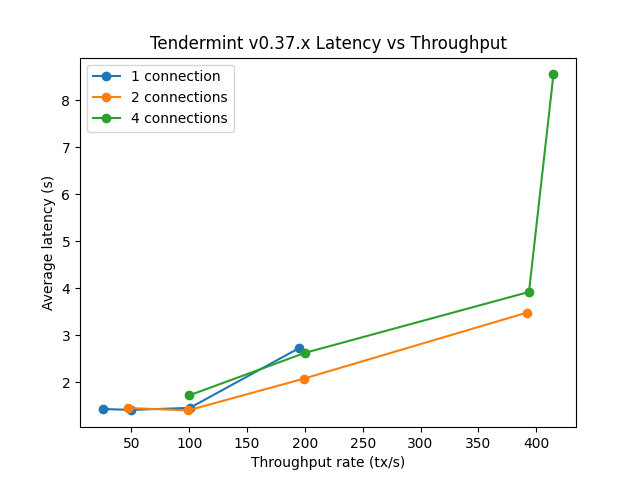
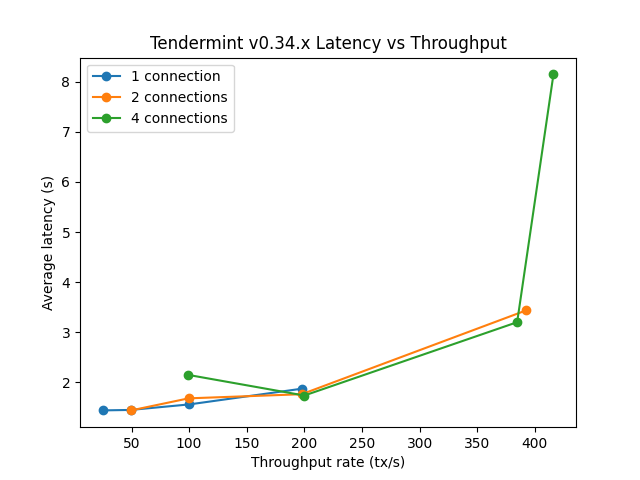
The first goal is to identify the saturation point and compare it with the baseline (v0.34.x). For further details, see this paragraph in the baseline version. The following table summarizes the results for v0.37.x for the different experiments (extracted from filev037_report_tabbed.txt).
The X axis of this table is c, the number of connections created by the load runner process to the target node.
The Y axis of this table is r, the rate or number of transactions issued per second.
| c=1 | c=2 | c=4 | |
|---|---|---|---|
| r=25 | 2225 | 4450 | 8900 |
| r=50 | 4450 | 8900 | 17800 |
| r=100 | 8900 | 17800 | 35600 |
| r=200 | 17800 | 35600 | 38660 |
| c=1 | c=2 | c=4 | |
|---|---|---|---|
| r=25 | 2225 | 4450 | 8900 |
| r=50 | 4450 | 8900 | 17800 |
| r=100 | 8900 | 17800 | 35400 |
| r=200 | 17800 | 35600 | 37358 |
r=200,c=2r=100,c=4
r=200,c=2.
The load runner’s CPU load was negligible (near 0) when running r=200,c=2.
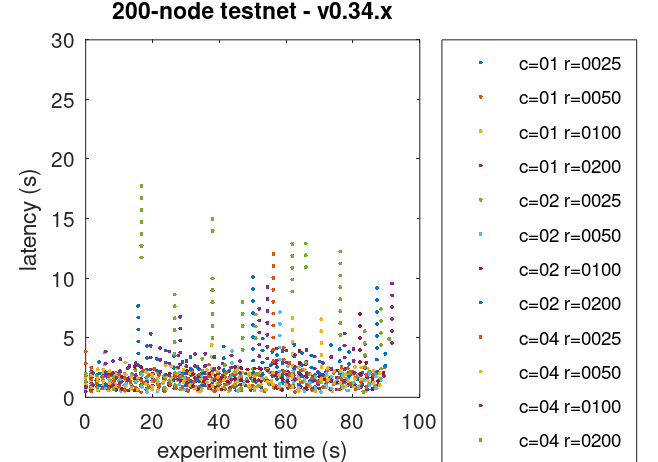
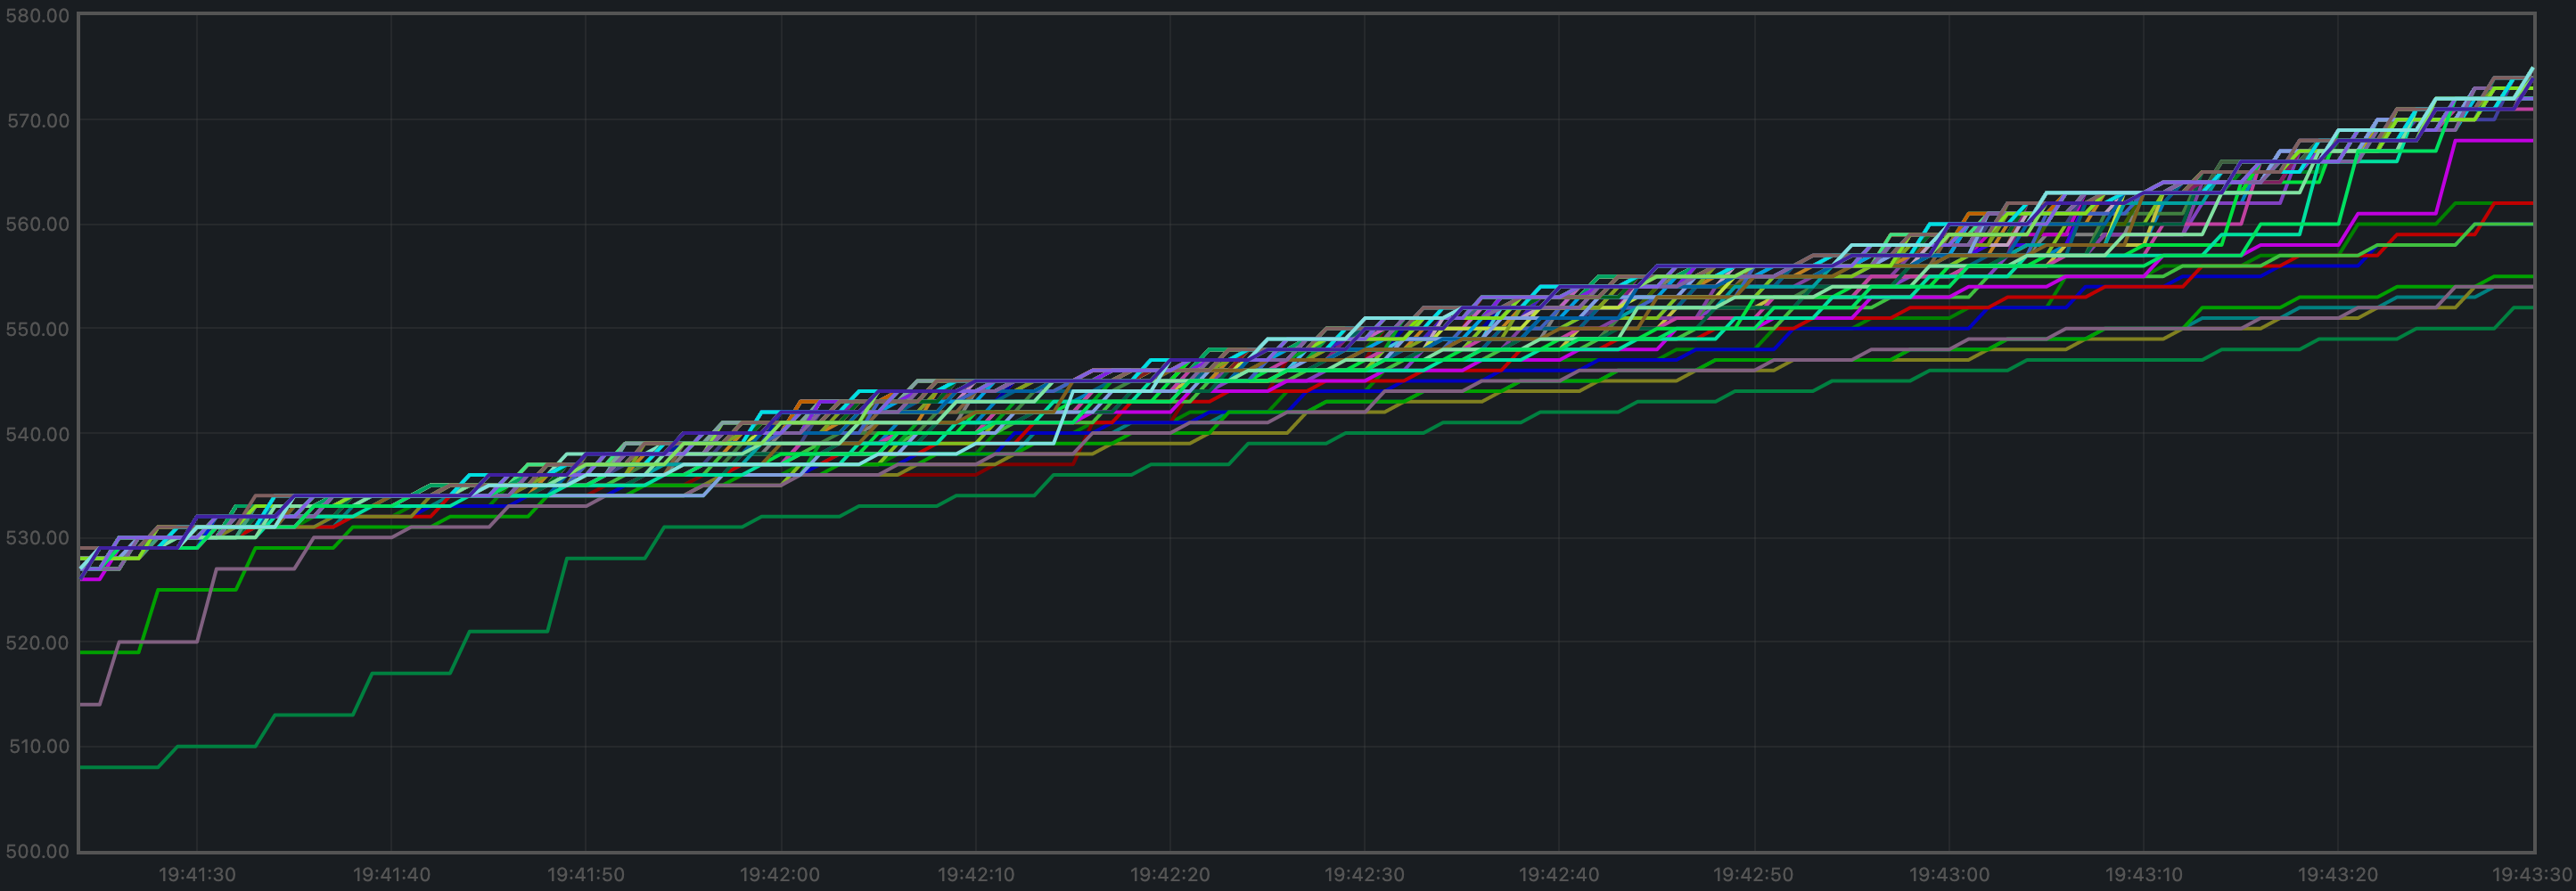
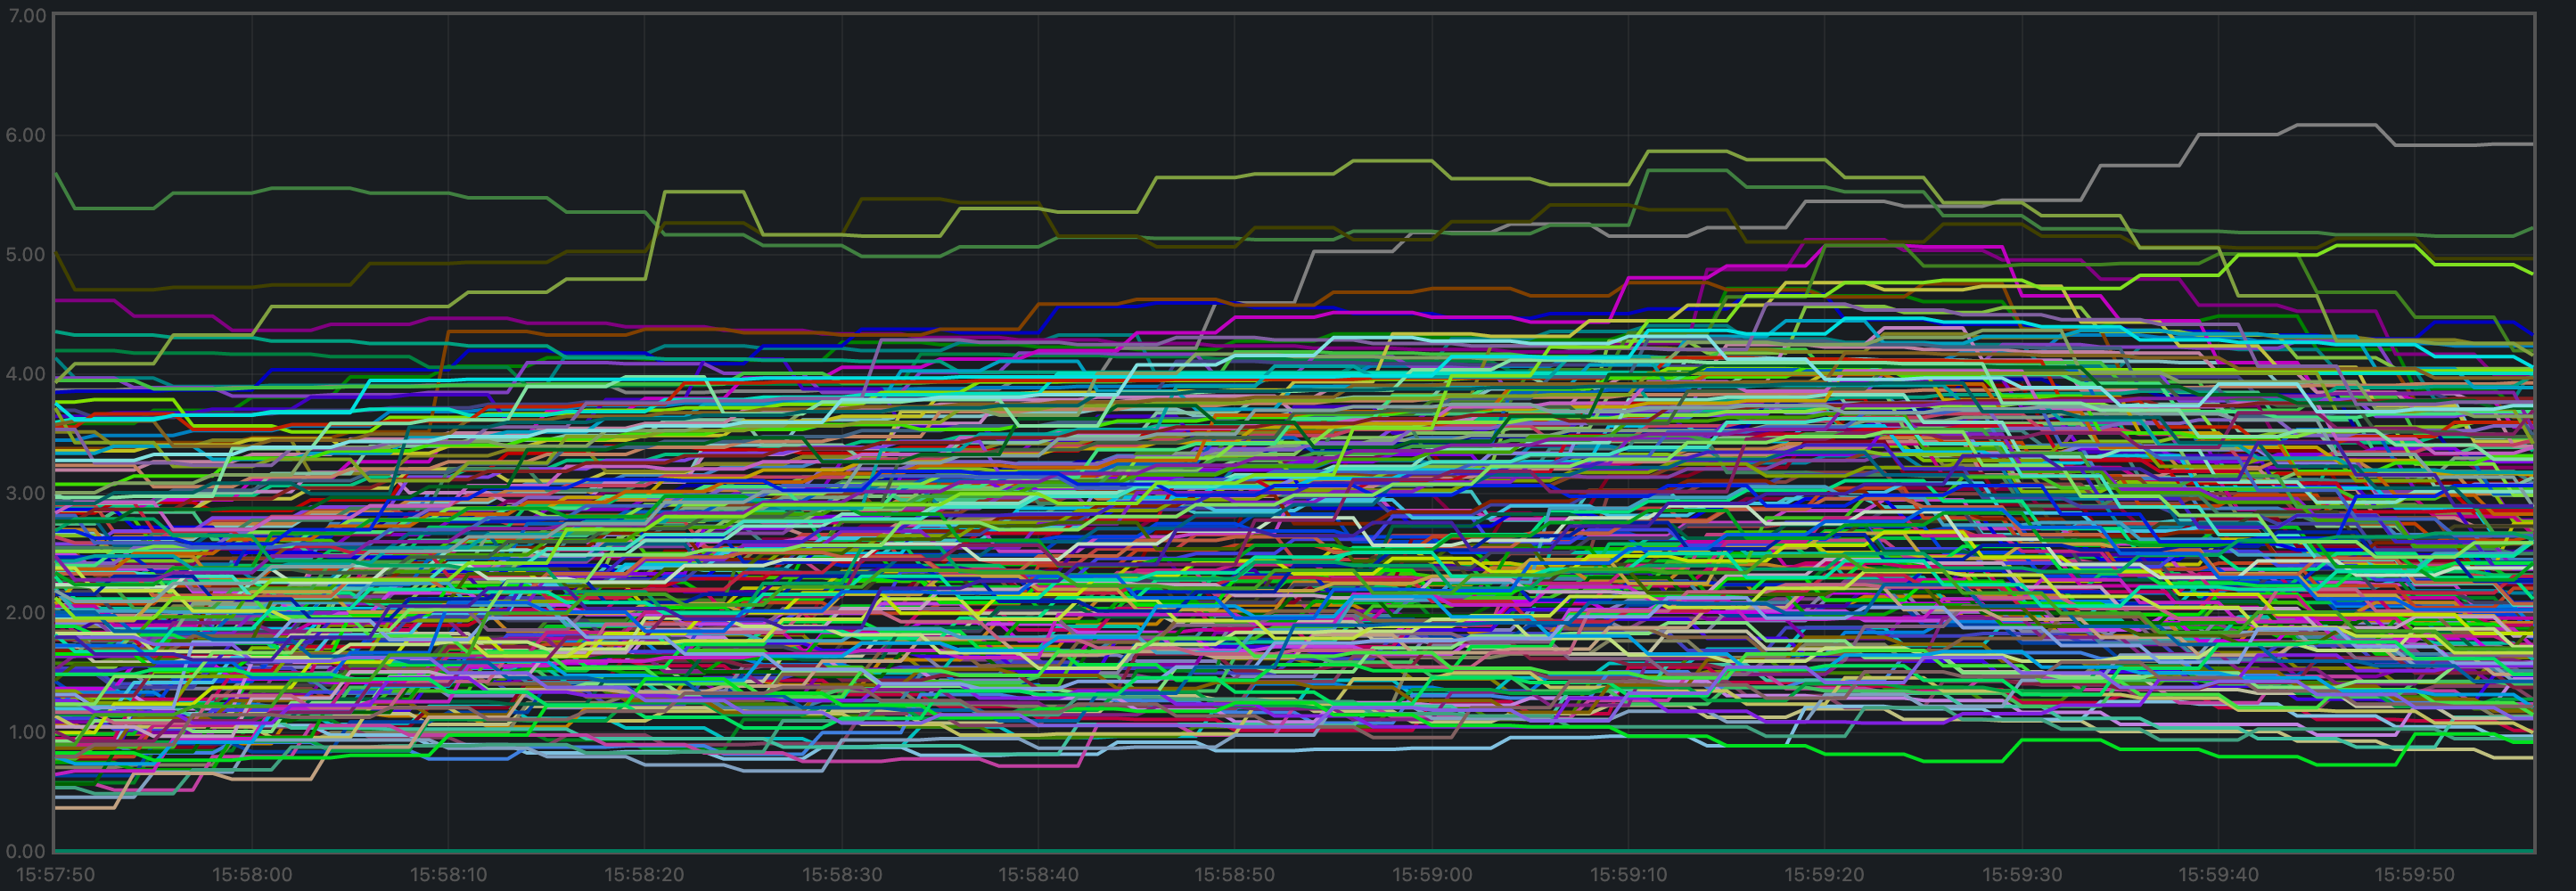
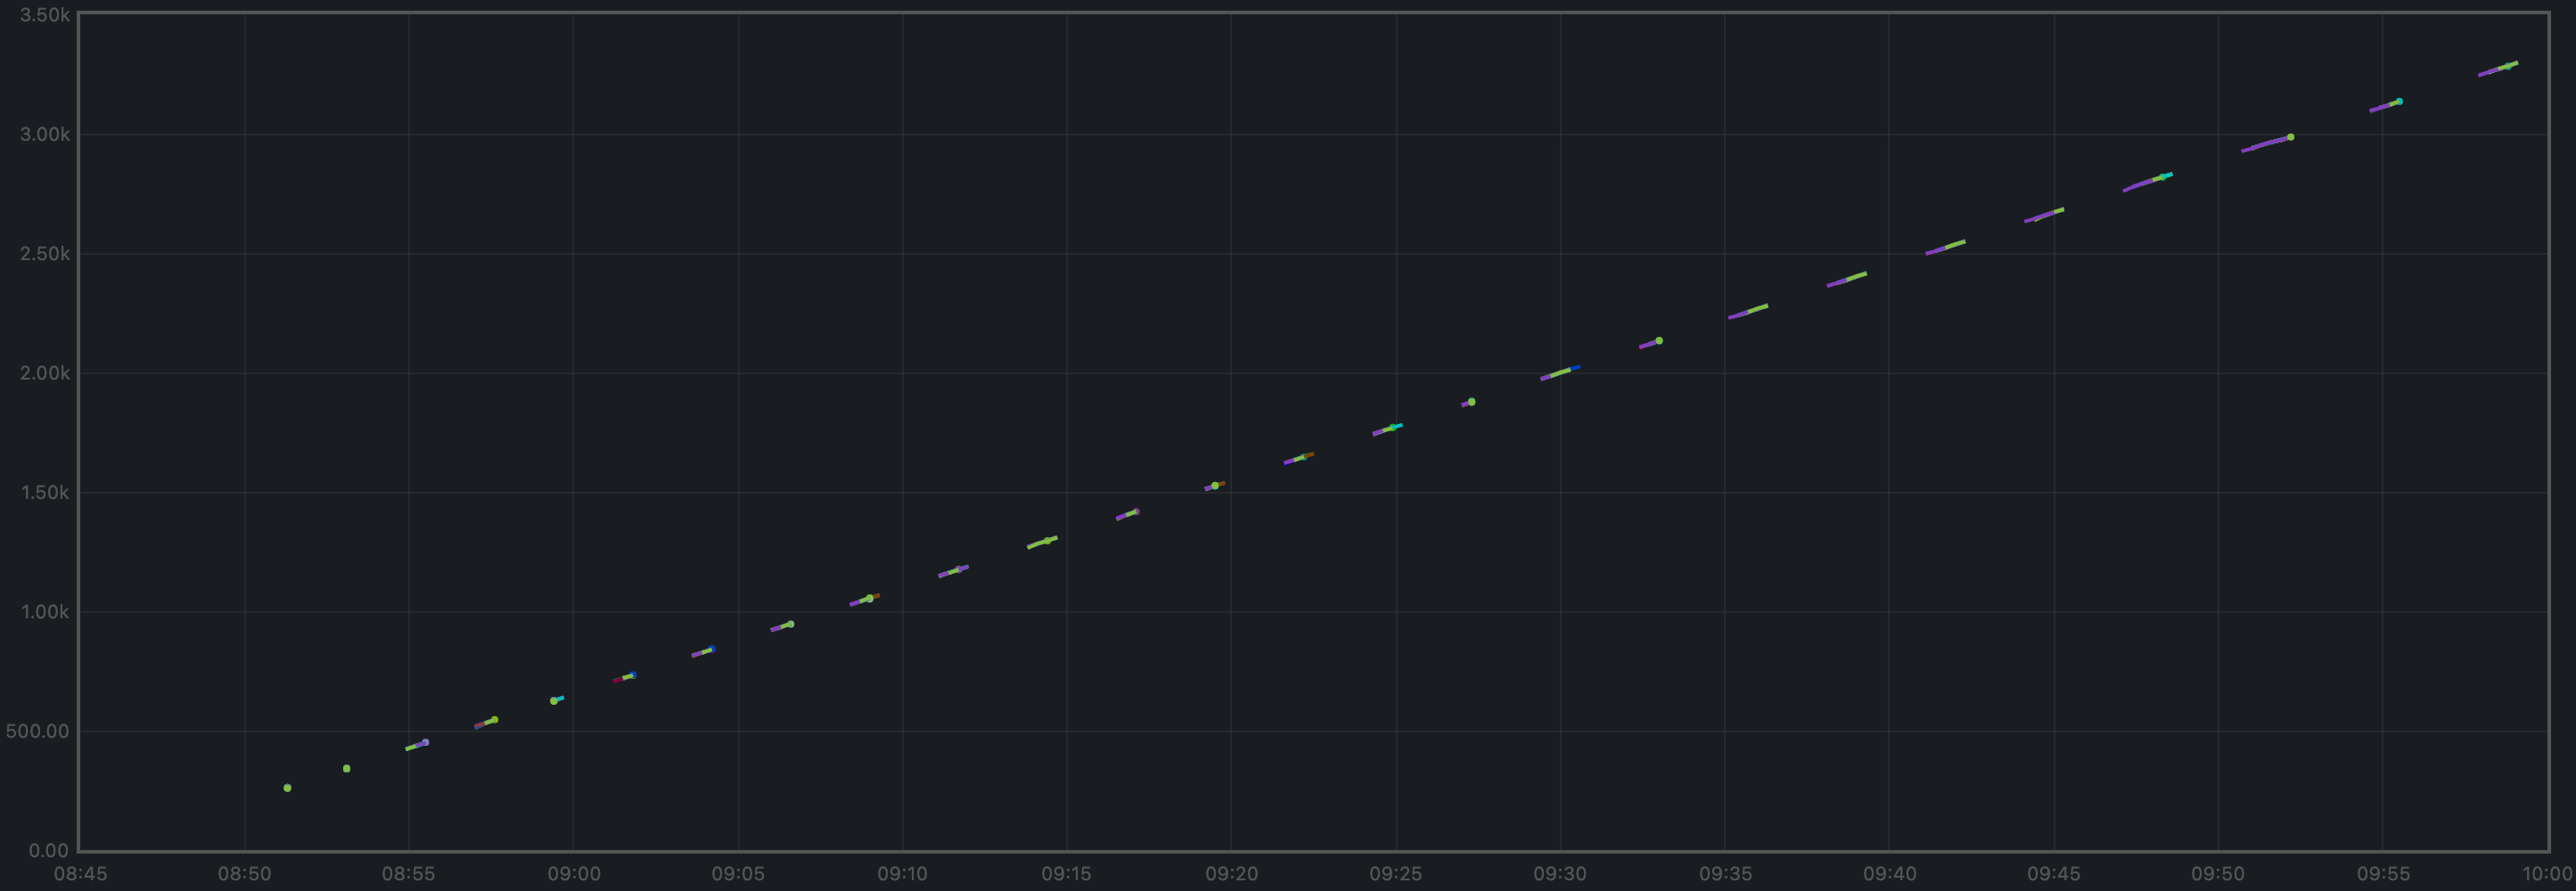
Examining Latencies
The method described here allows us to plot the latencies of transactions for all experiments.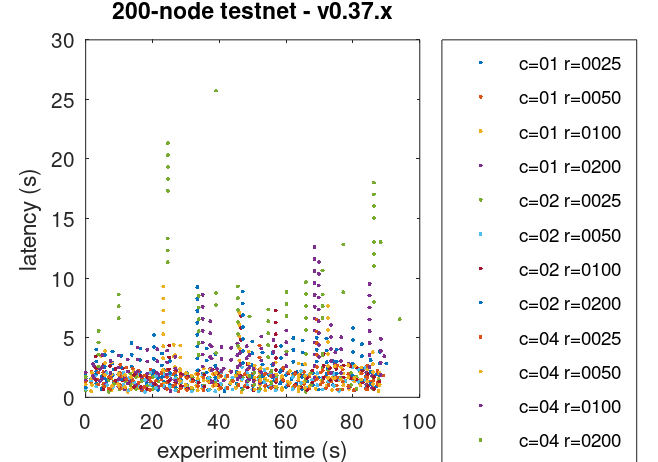
Prometheus Metrics on the Chosen Experiment
As mentioned above, the chosen experiment isr=200,c=2.
This section further examines key metrics for this experiment extracted from Prometheus data.
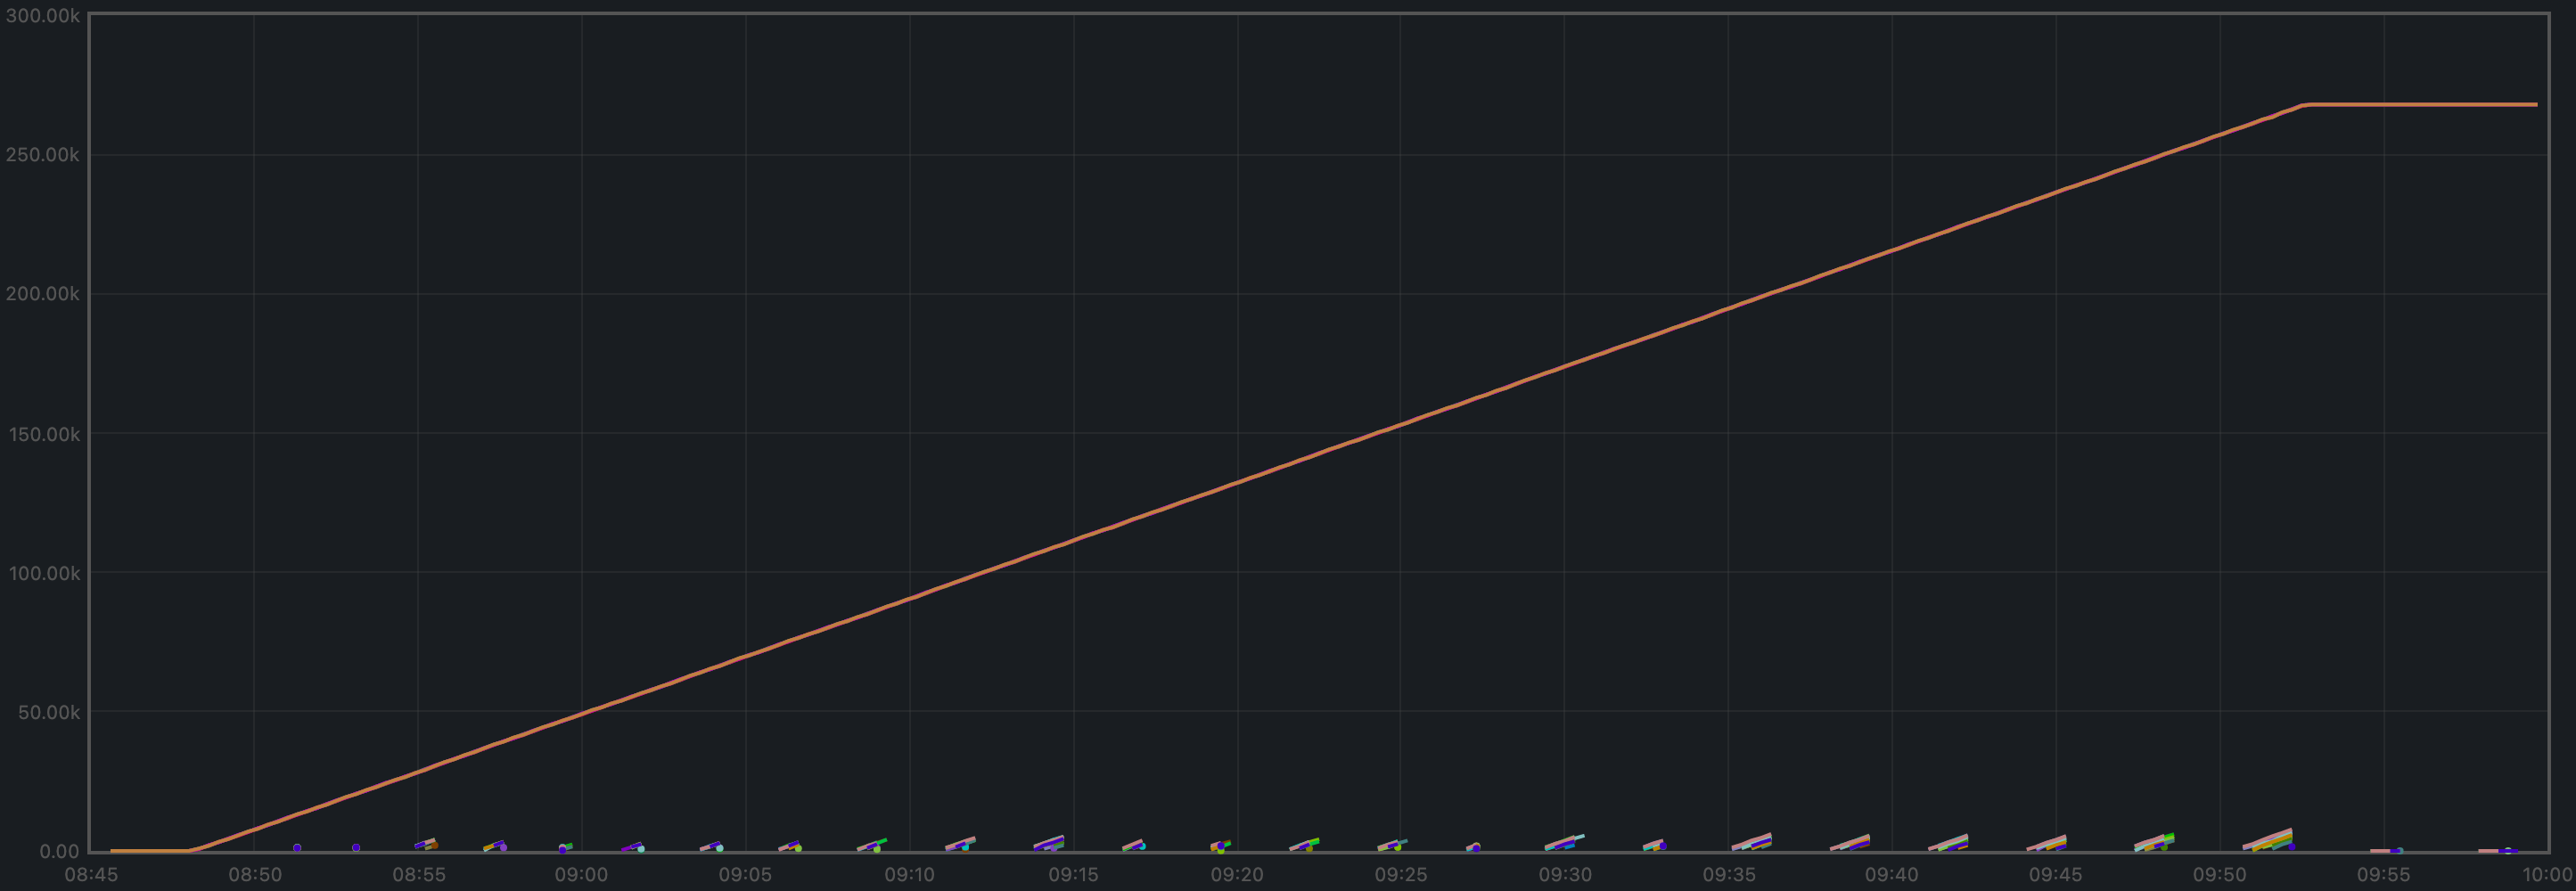
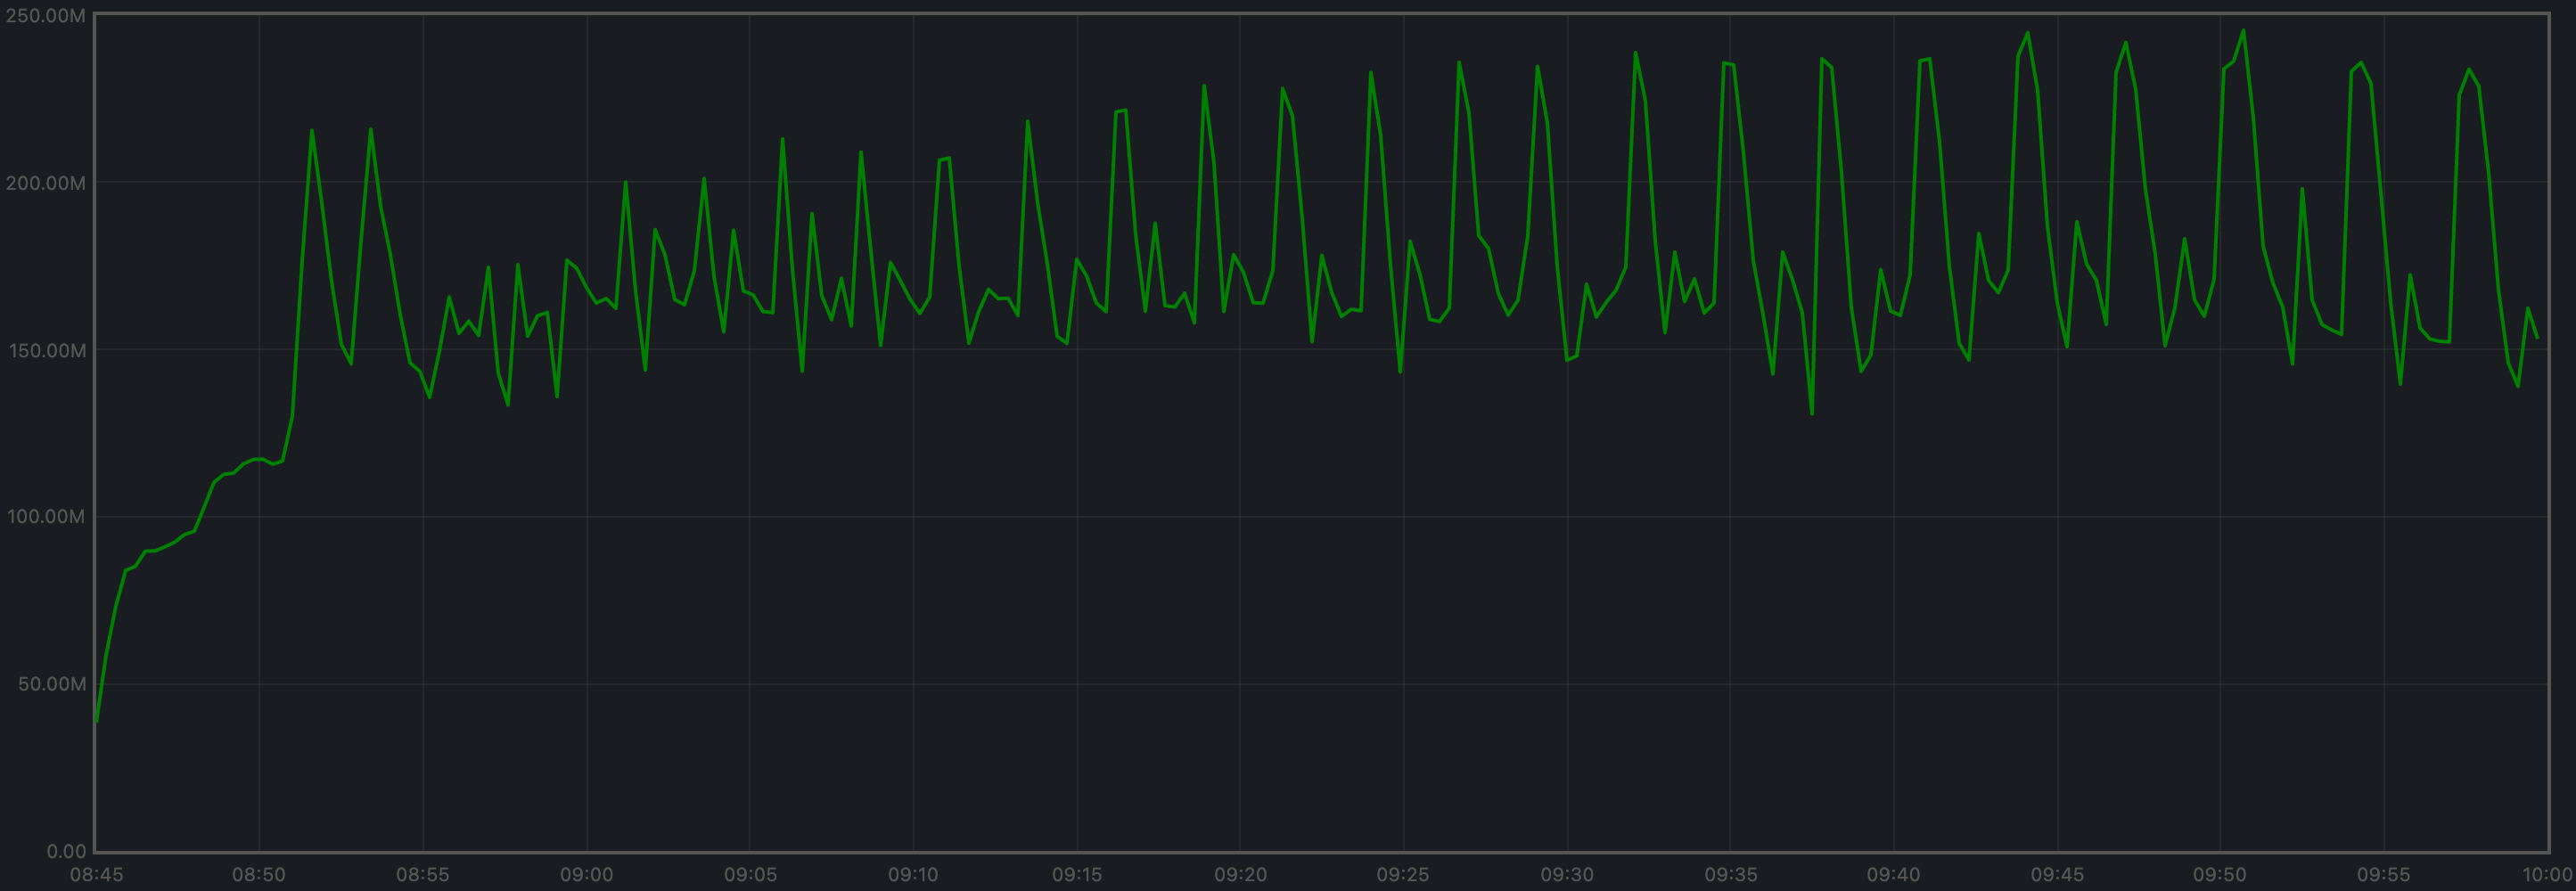
Mempool Size
The mempool size, a count of the number of transactions in the mempool, was shown to be stable and homogeneous at all full nodes. It did not exhibit any unconstrained growth. The plot below shows the evolution over time of the cumulative number of transactions inside all full nodes’ mempools at a given time.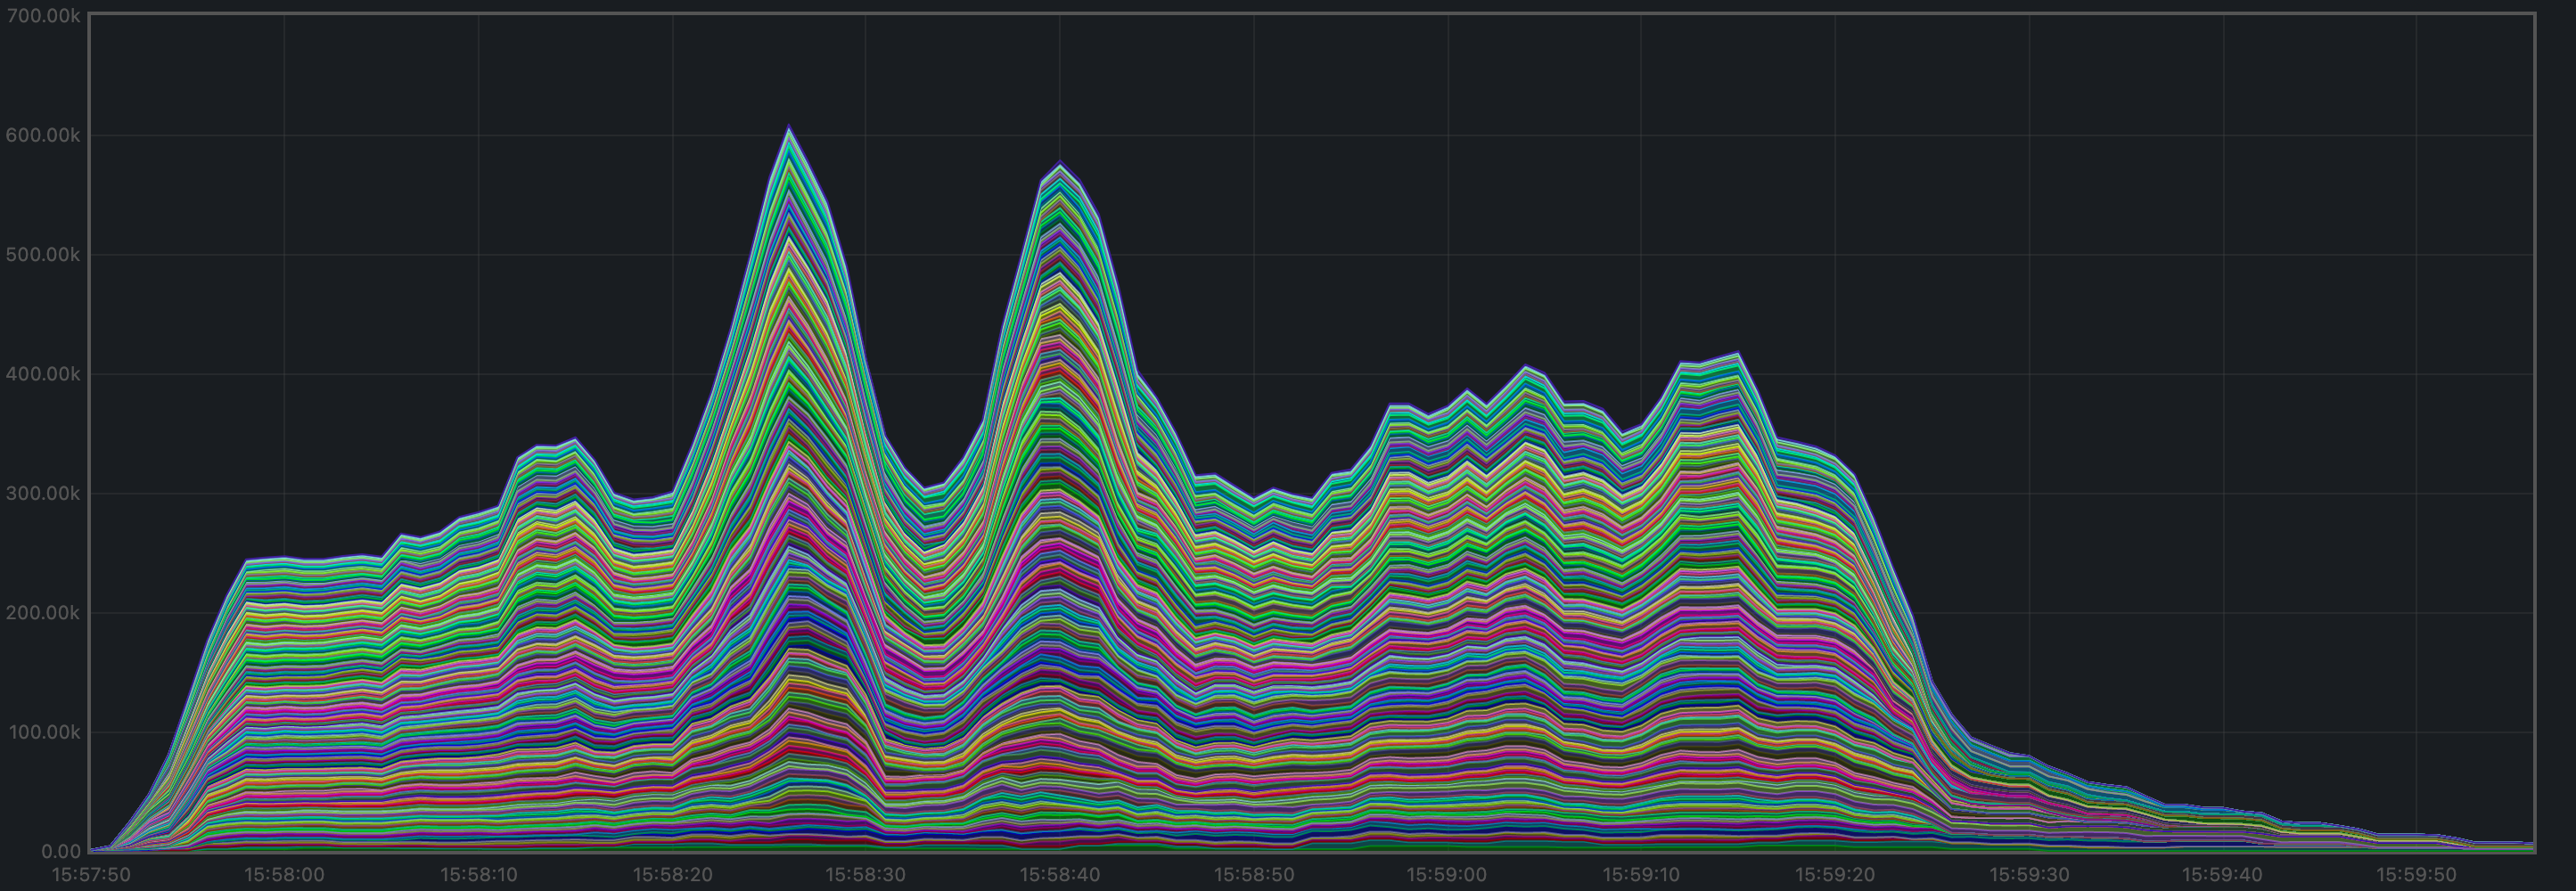
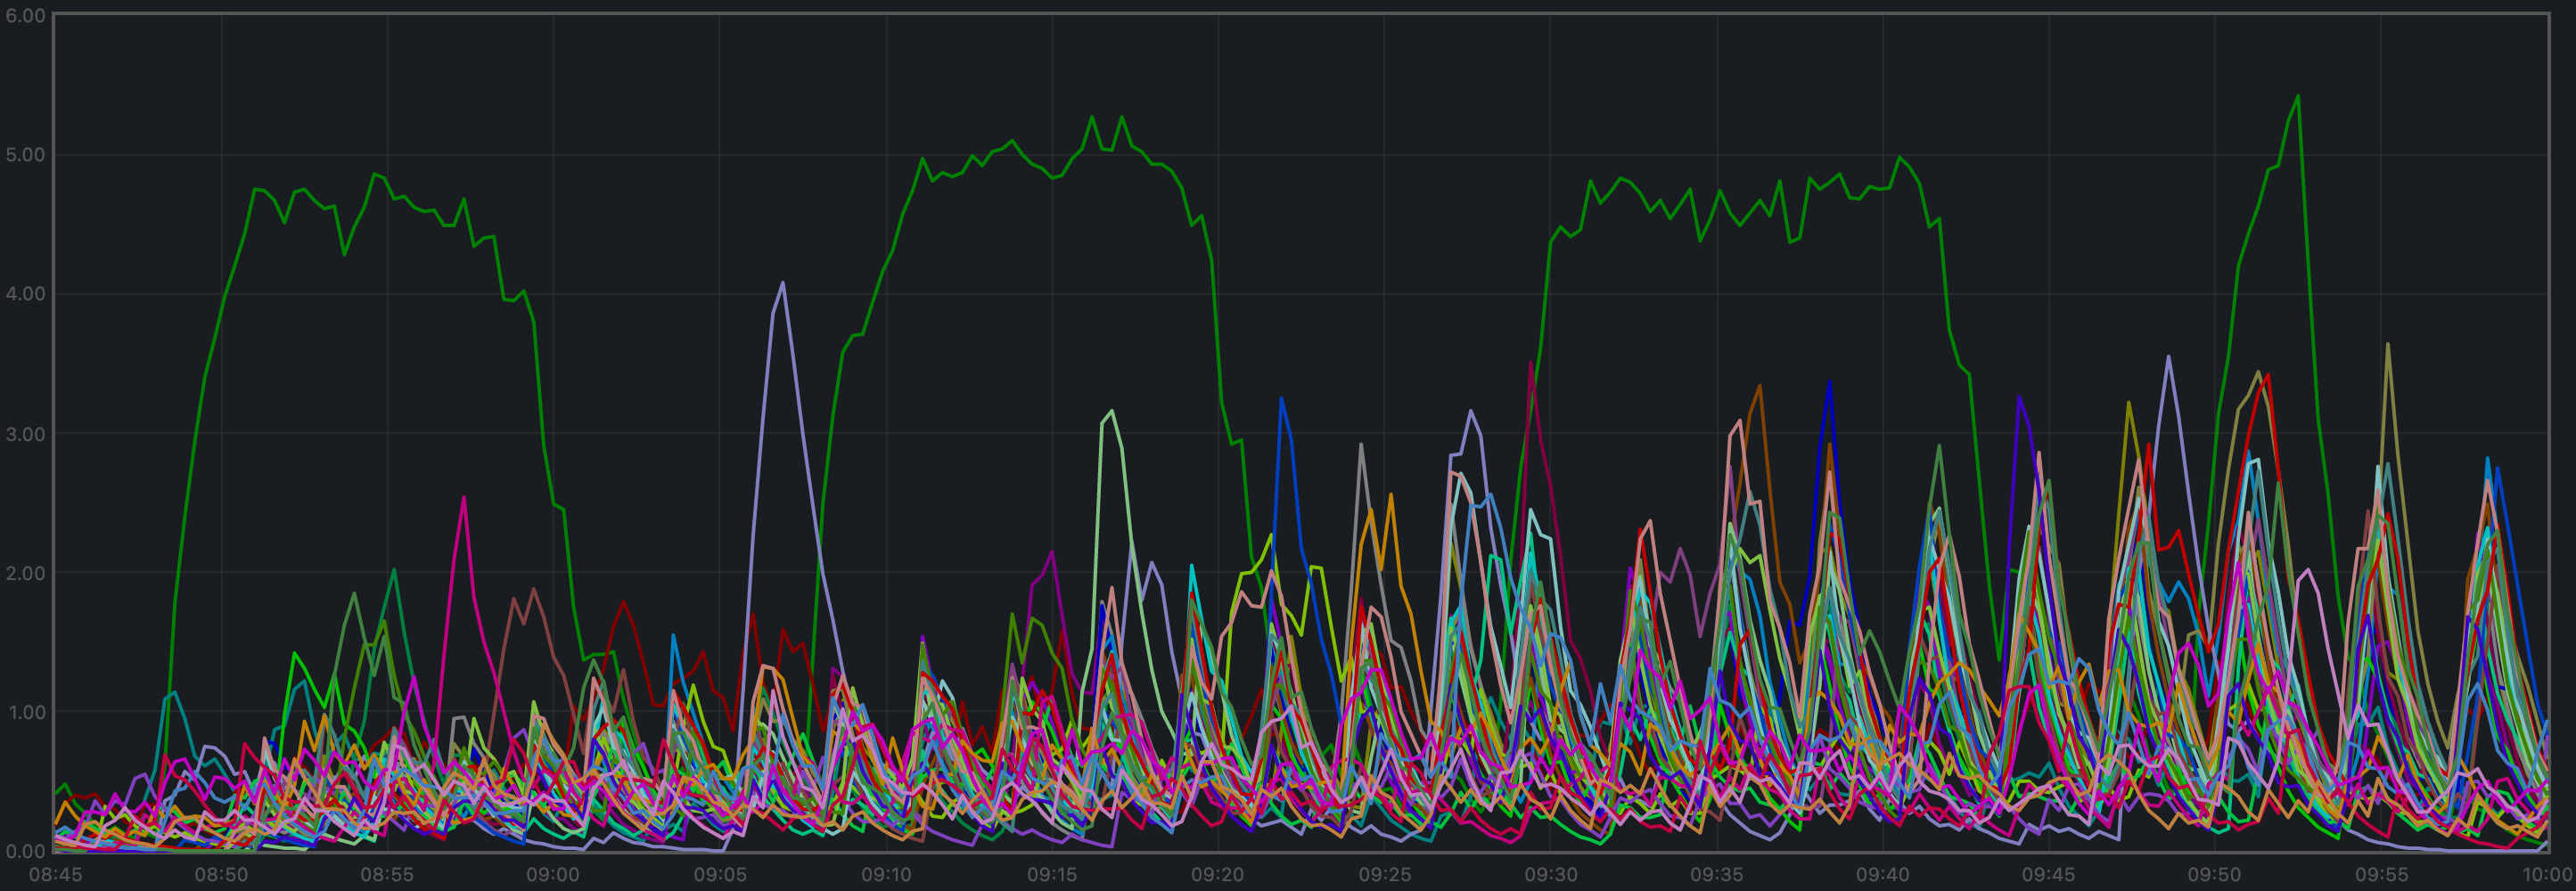
Peers
The number of peers was stable at all nodes. It was higher for the seed nodes (around 140) than for the rest (between 16 and 78).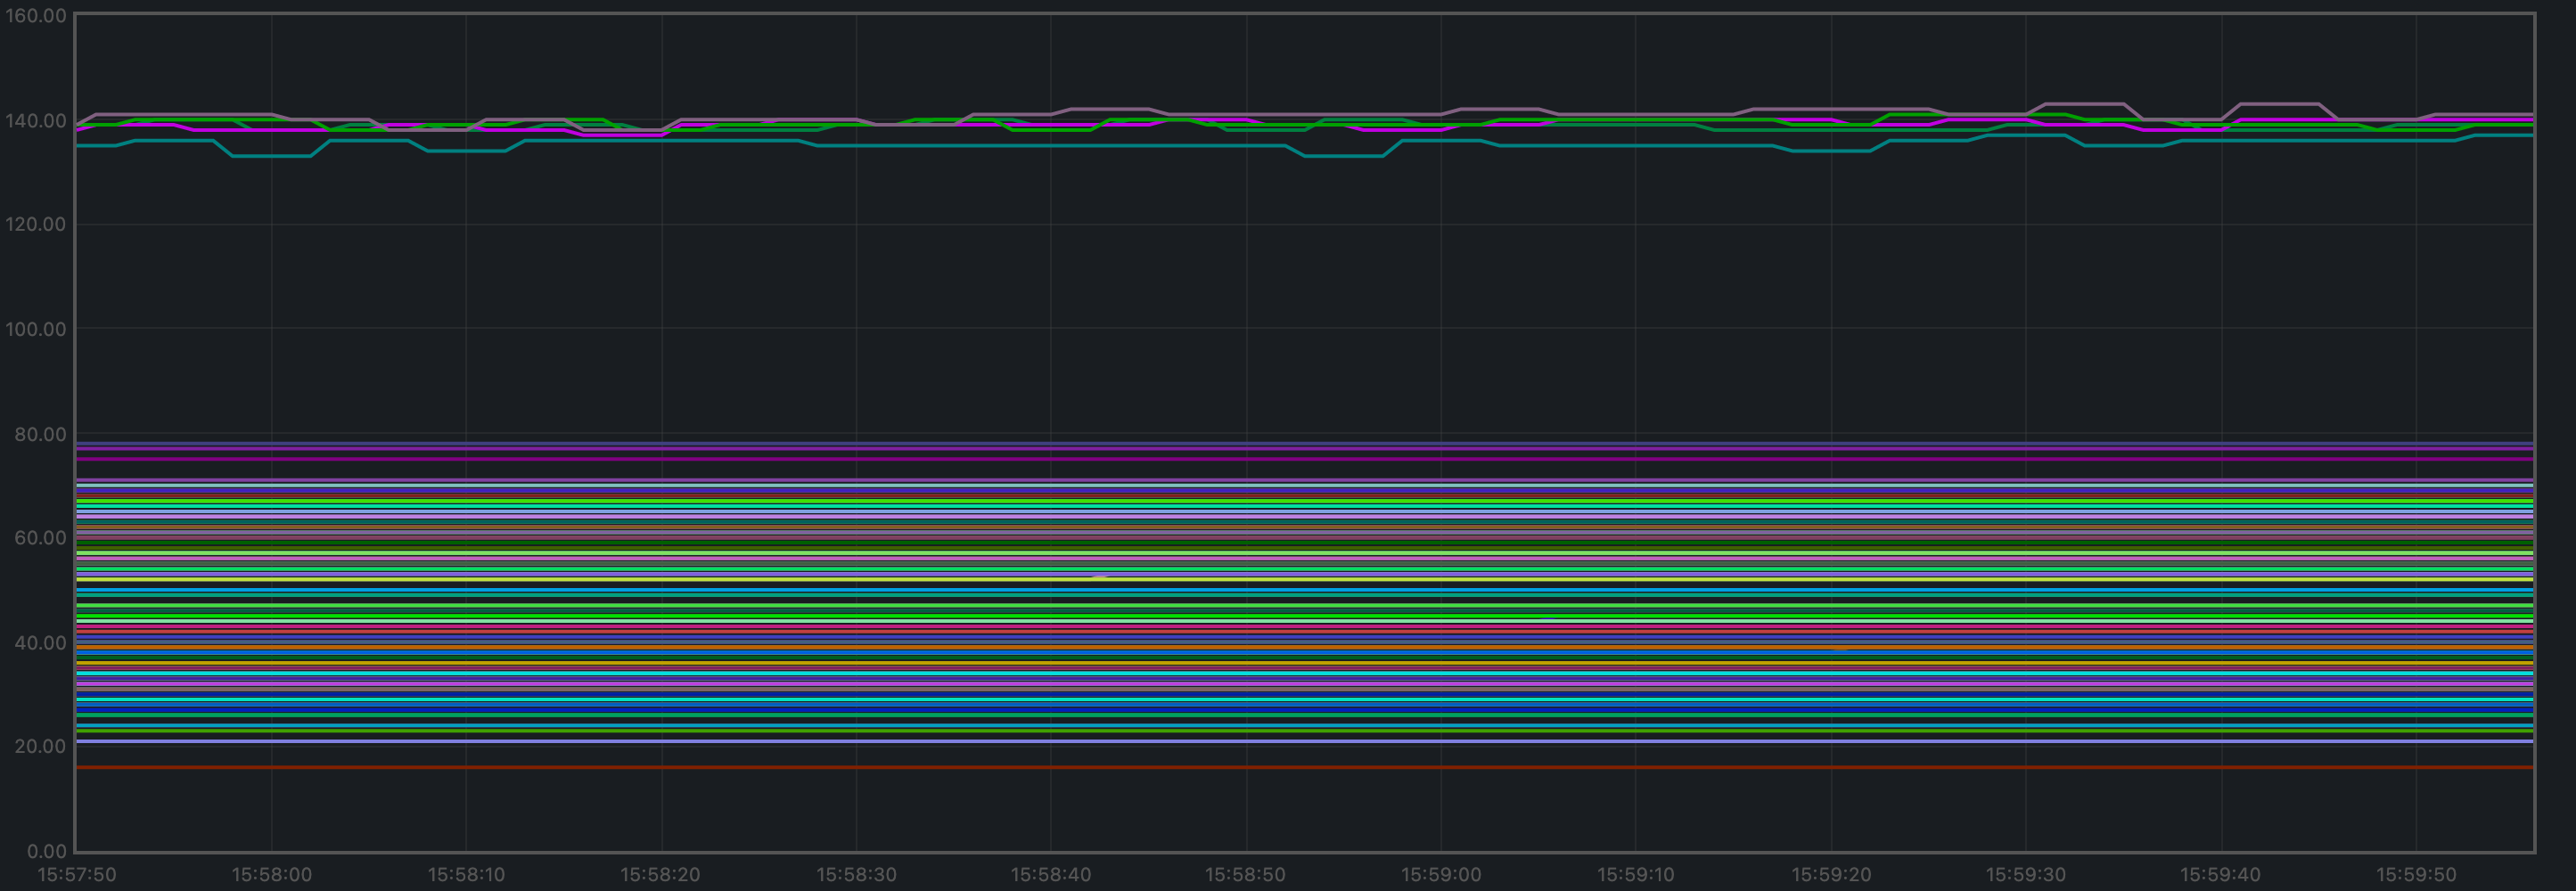
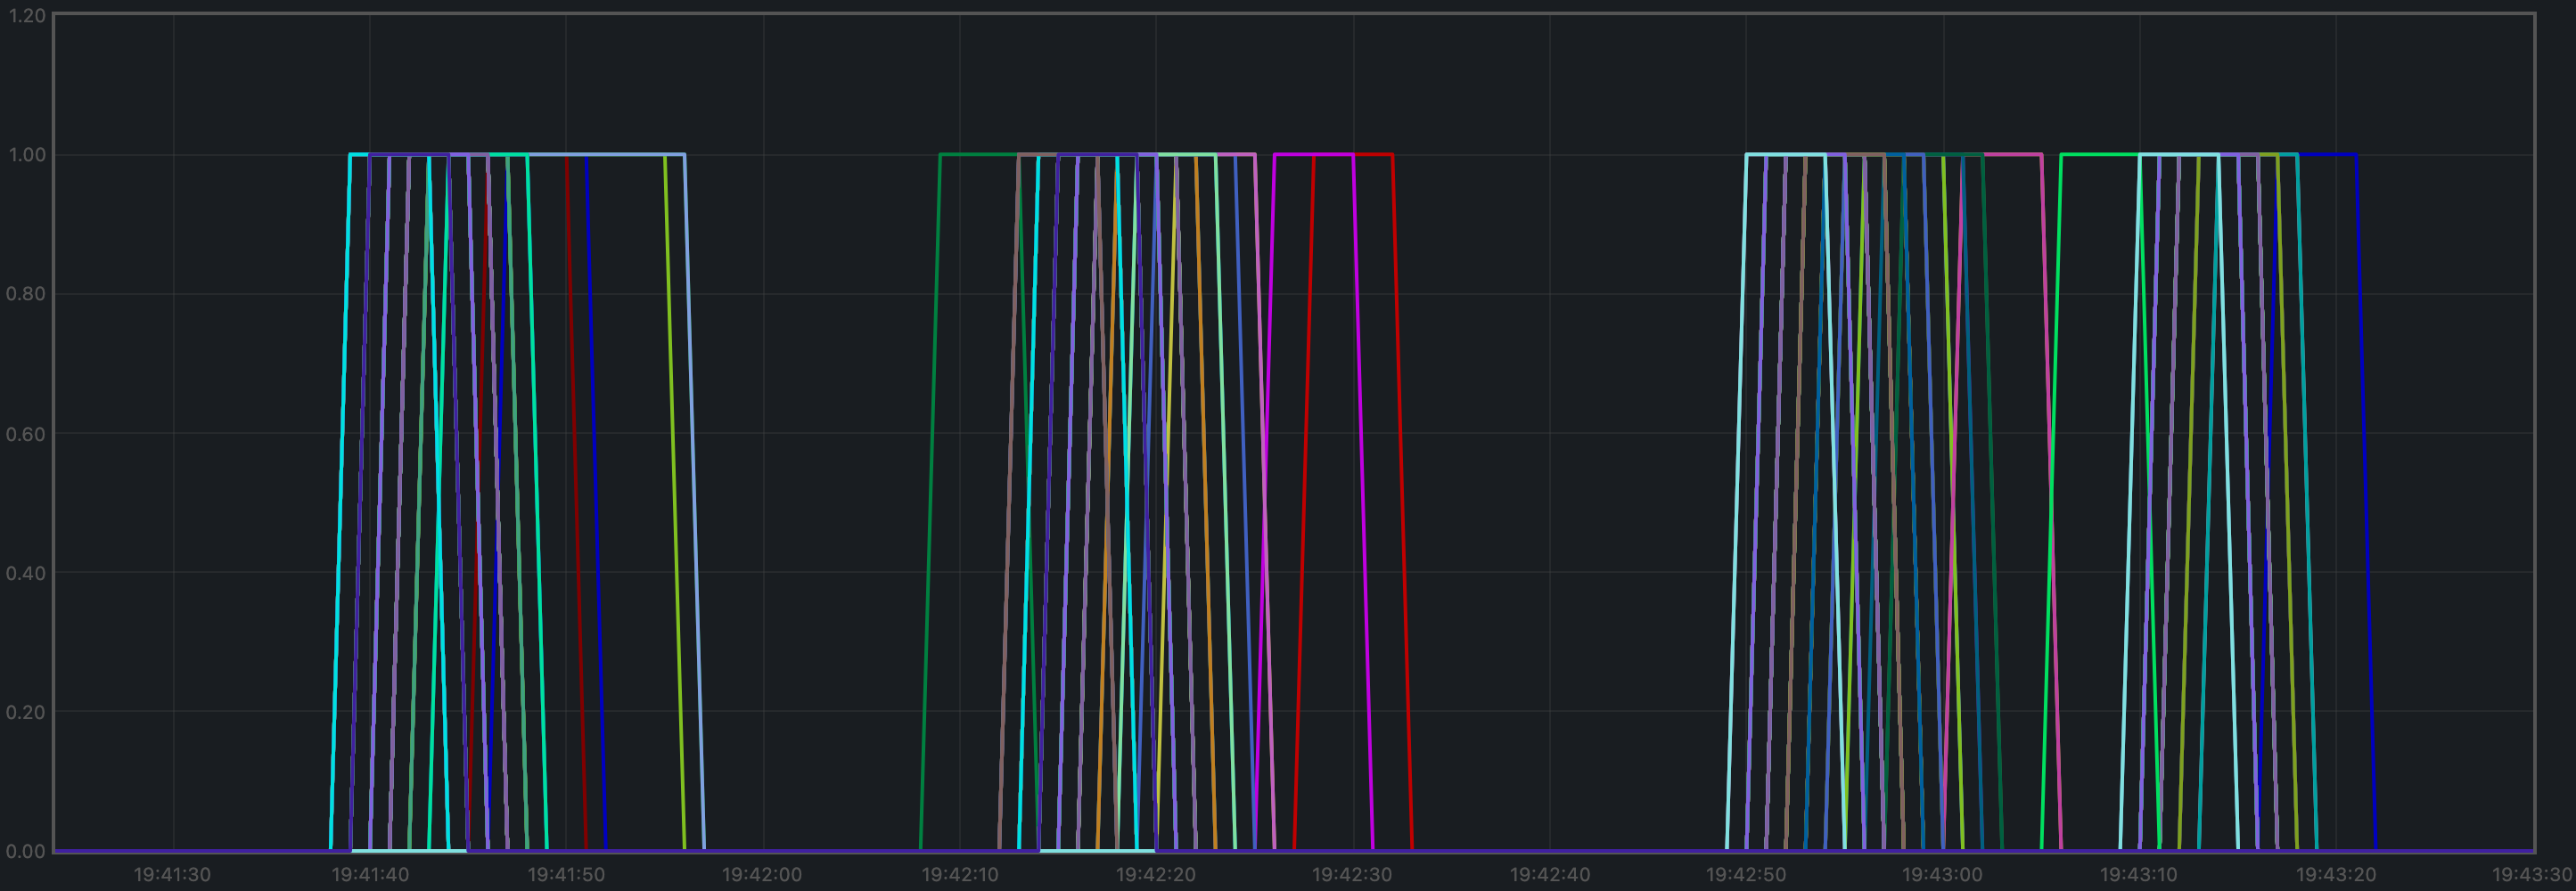
Consensus Rounds per Height
Most heights took just one round, but some nodes needed to advance to round 1 at some point.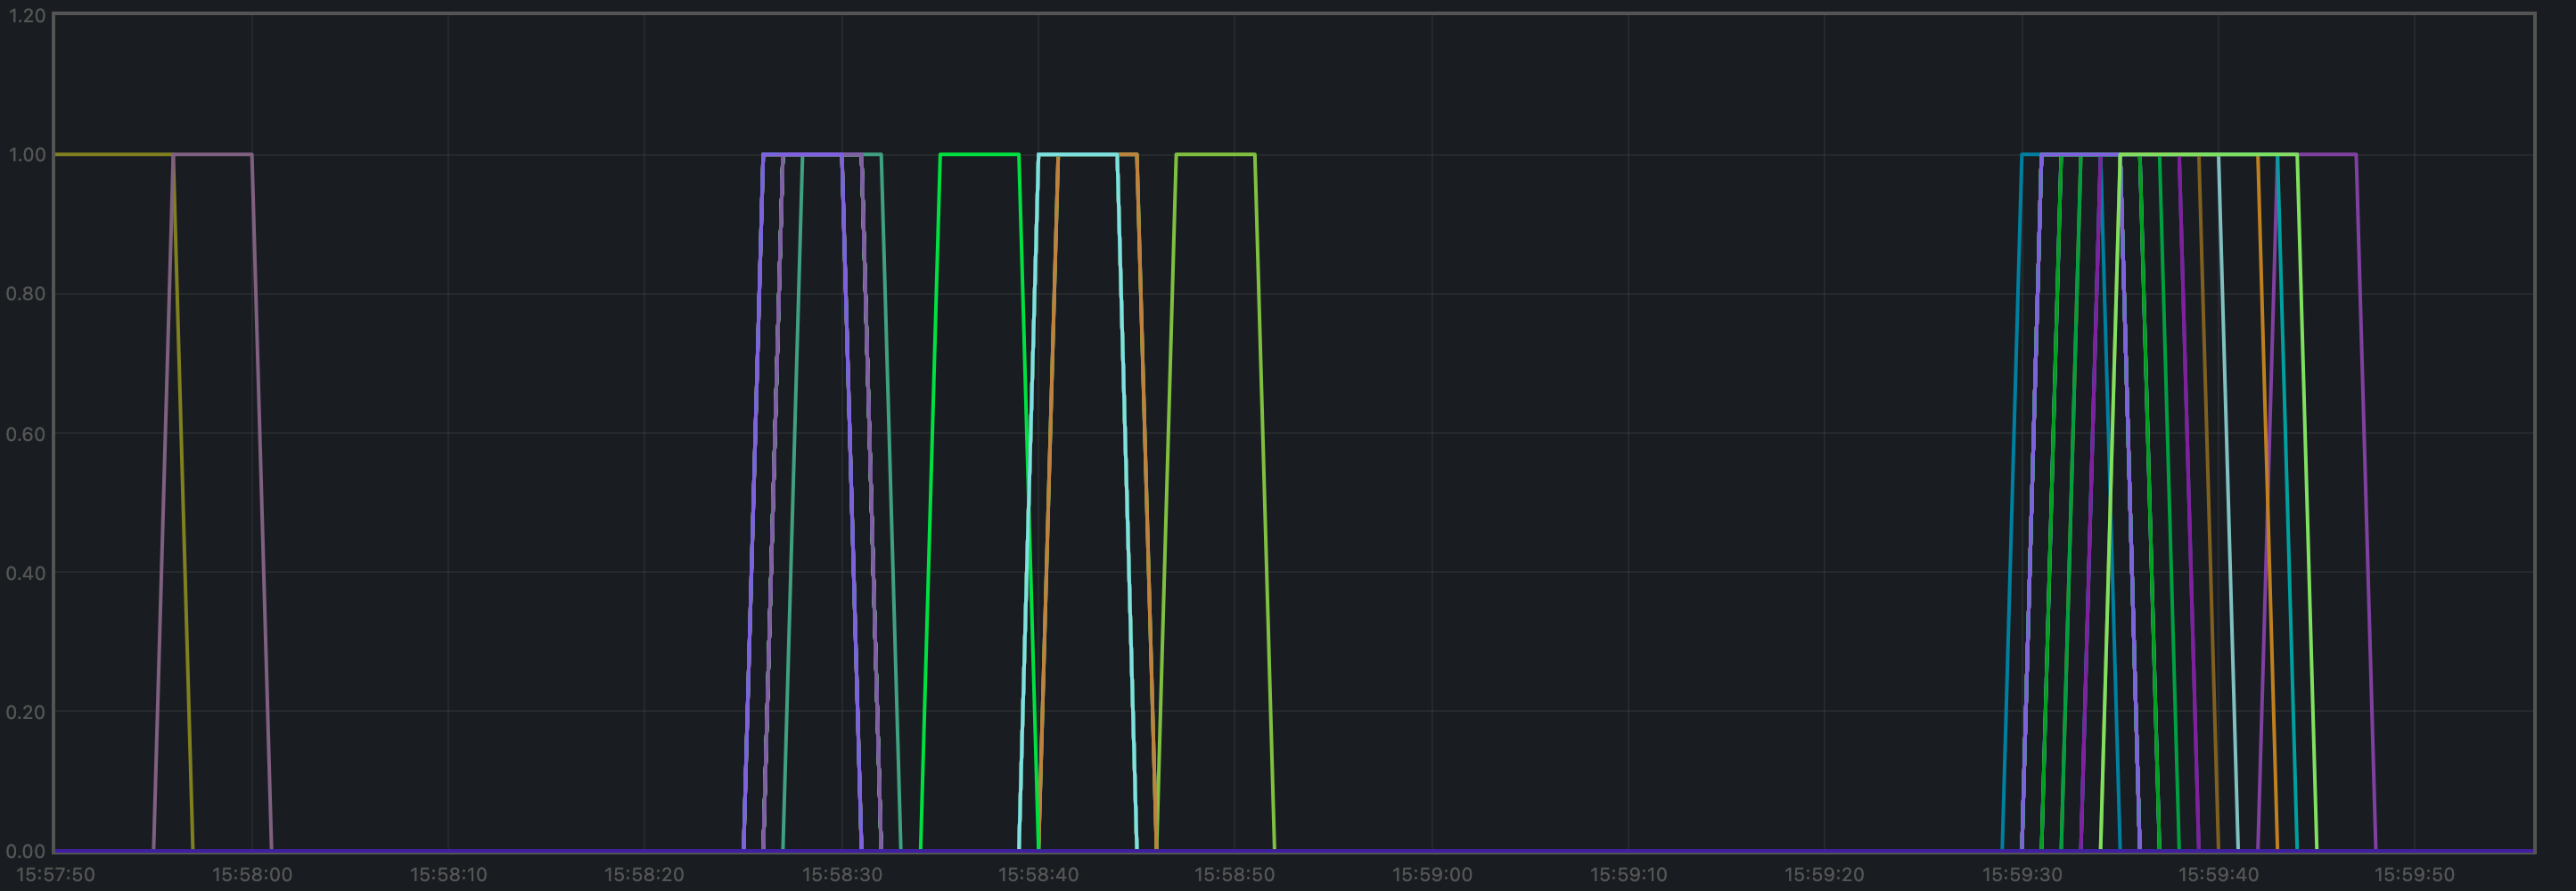
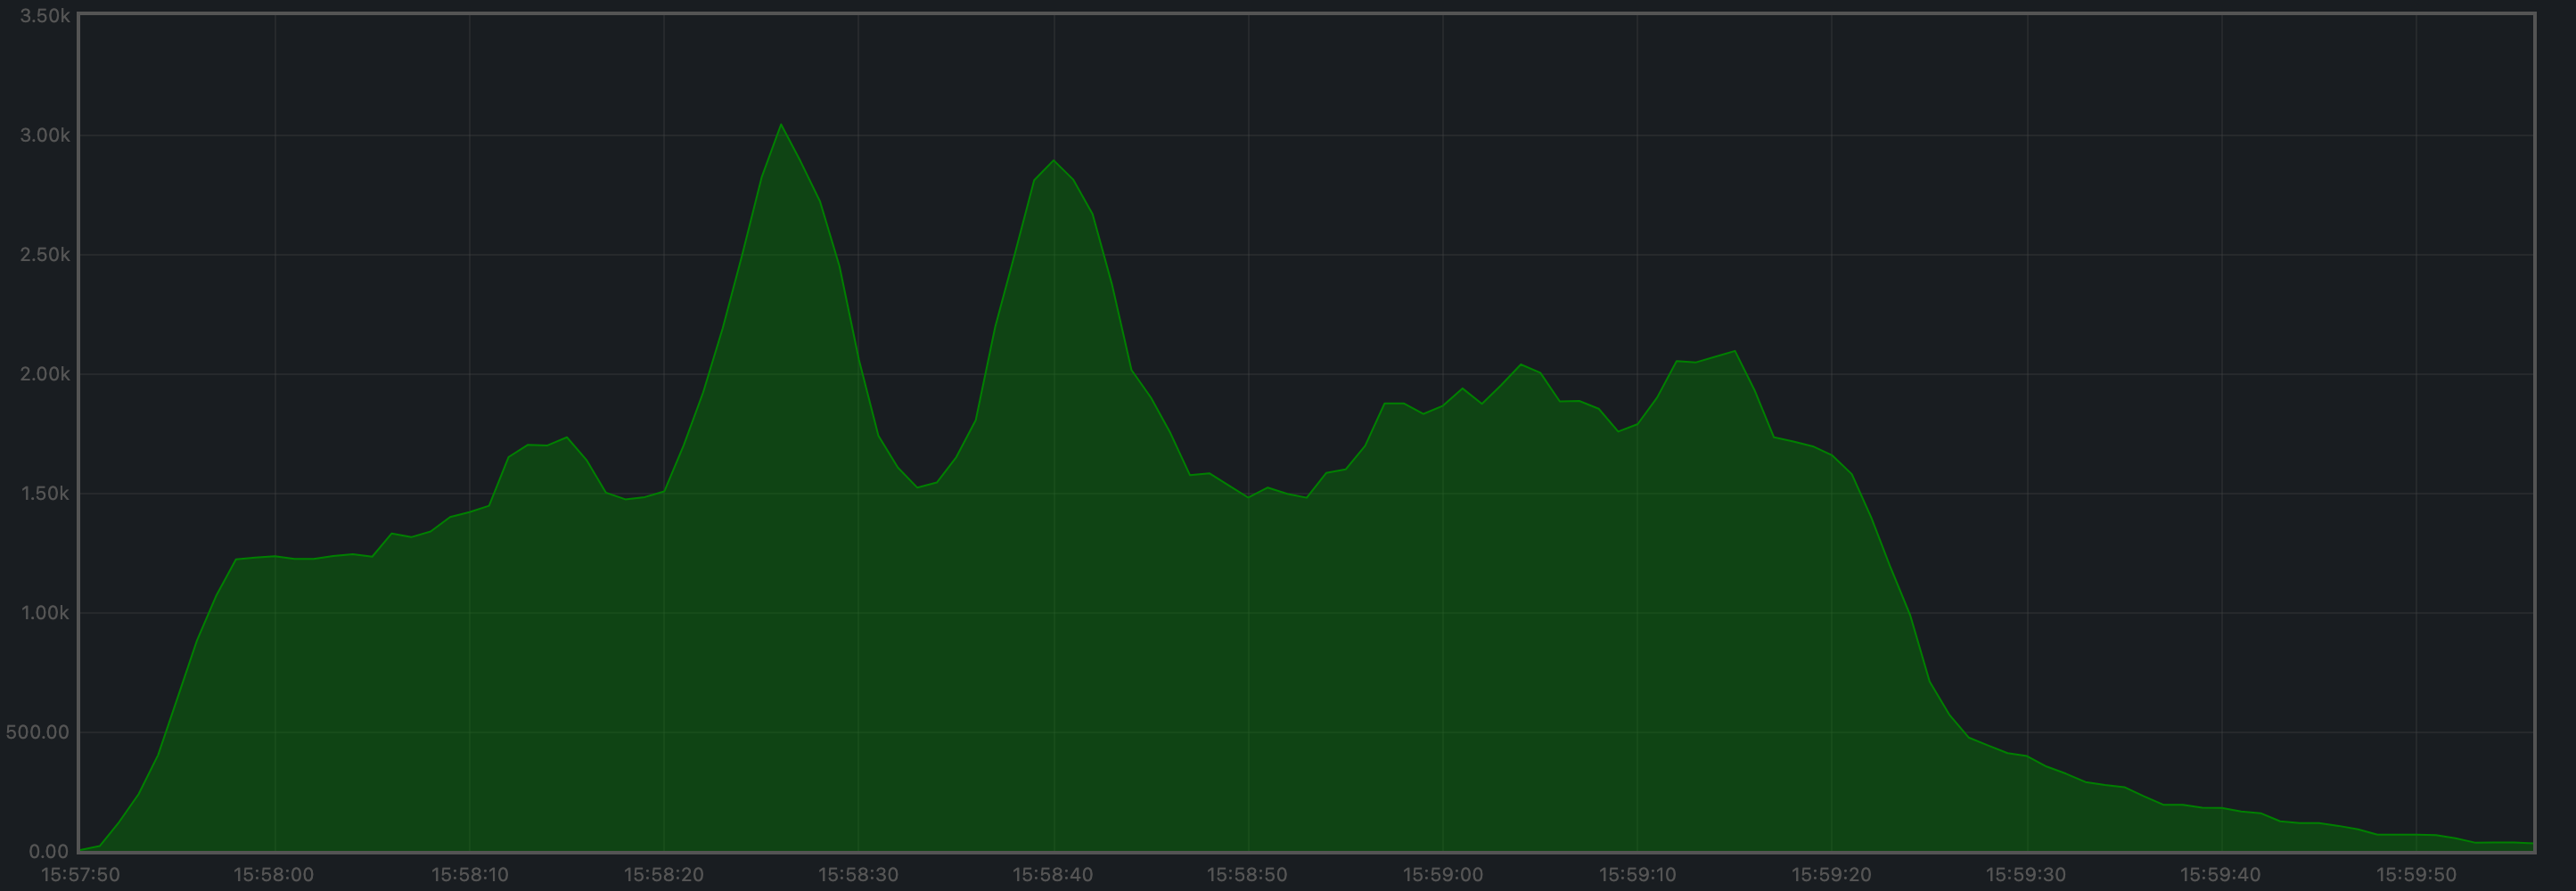
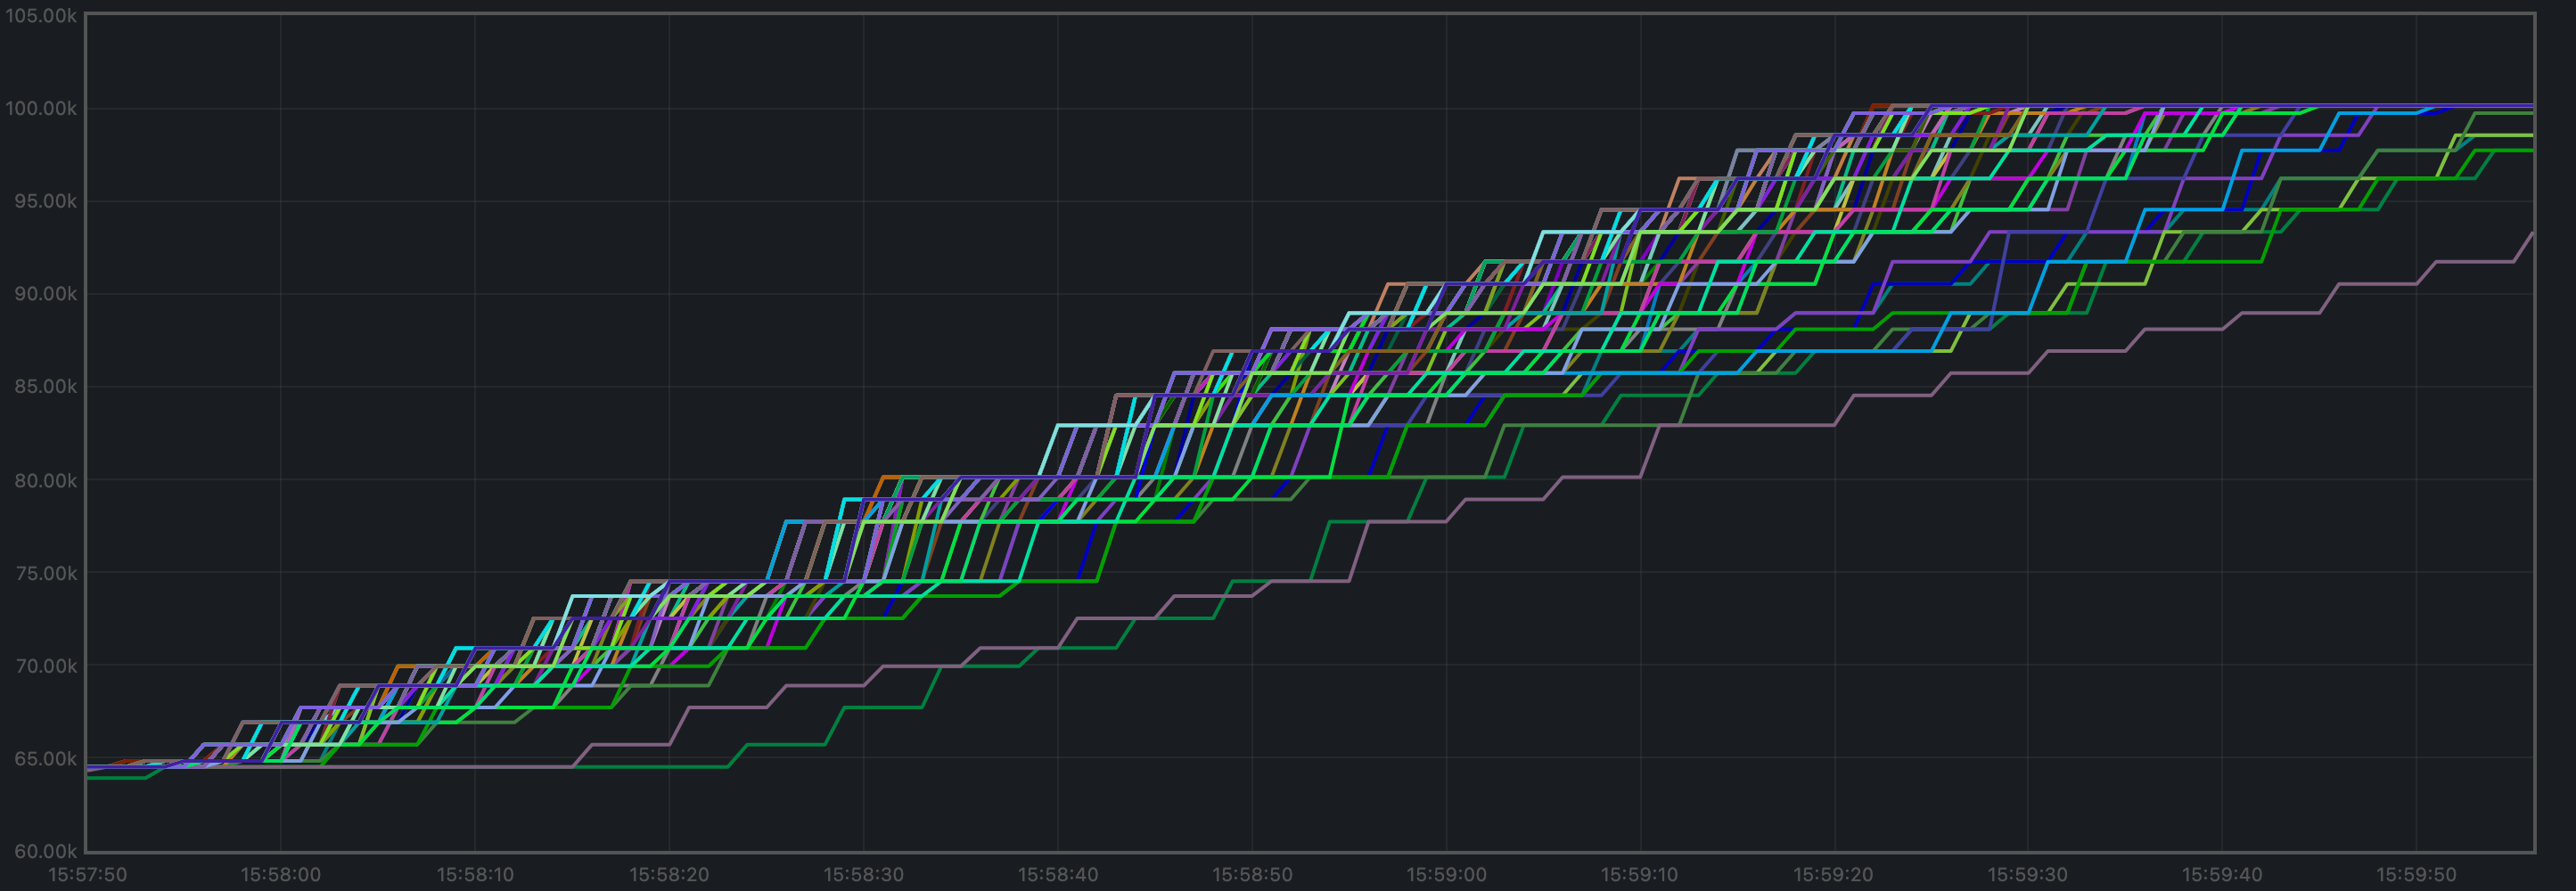
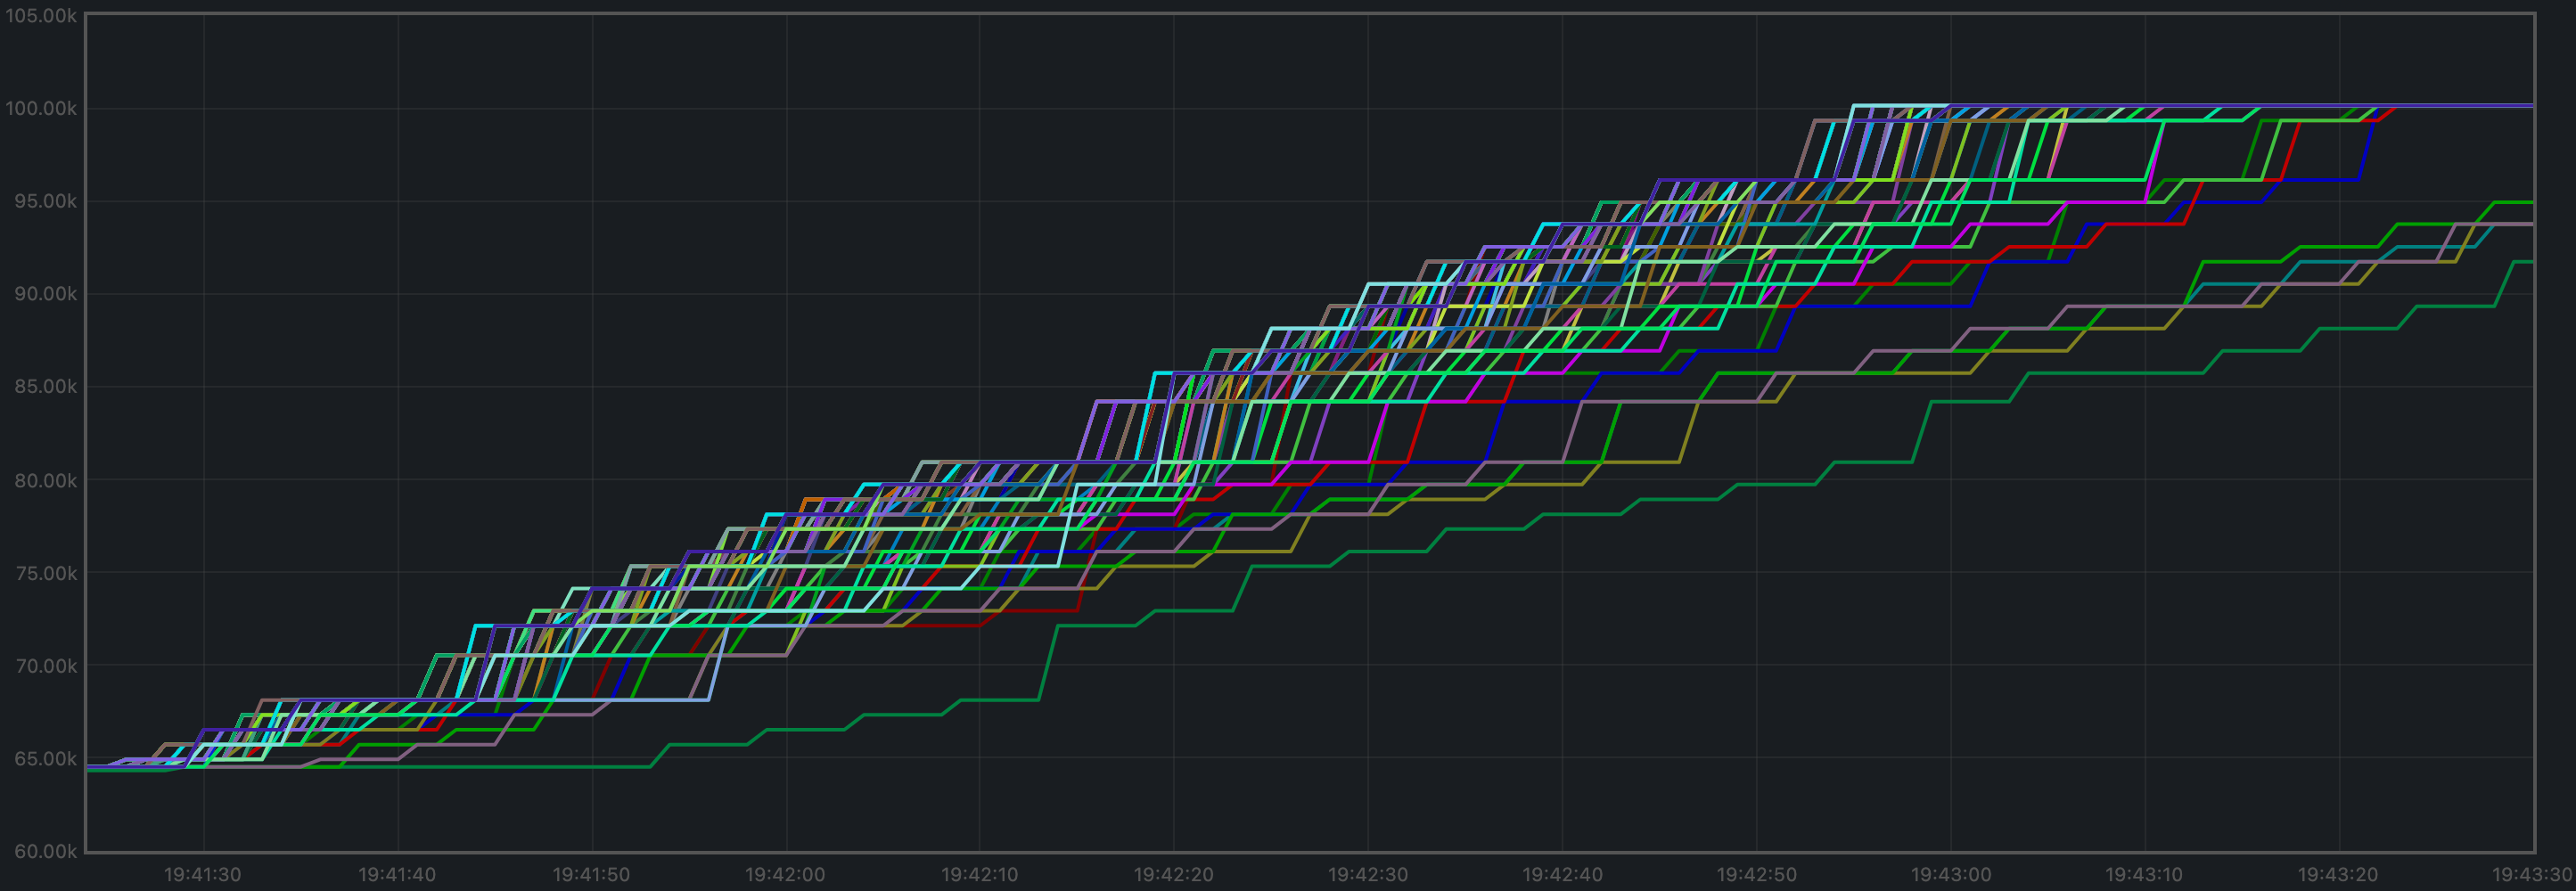
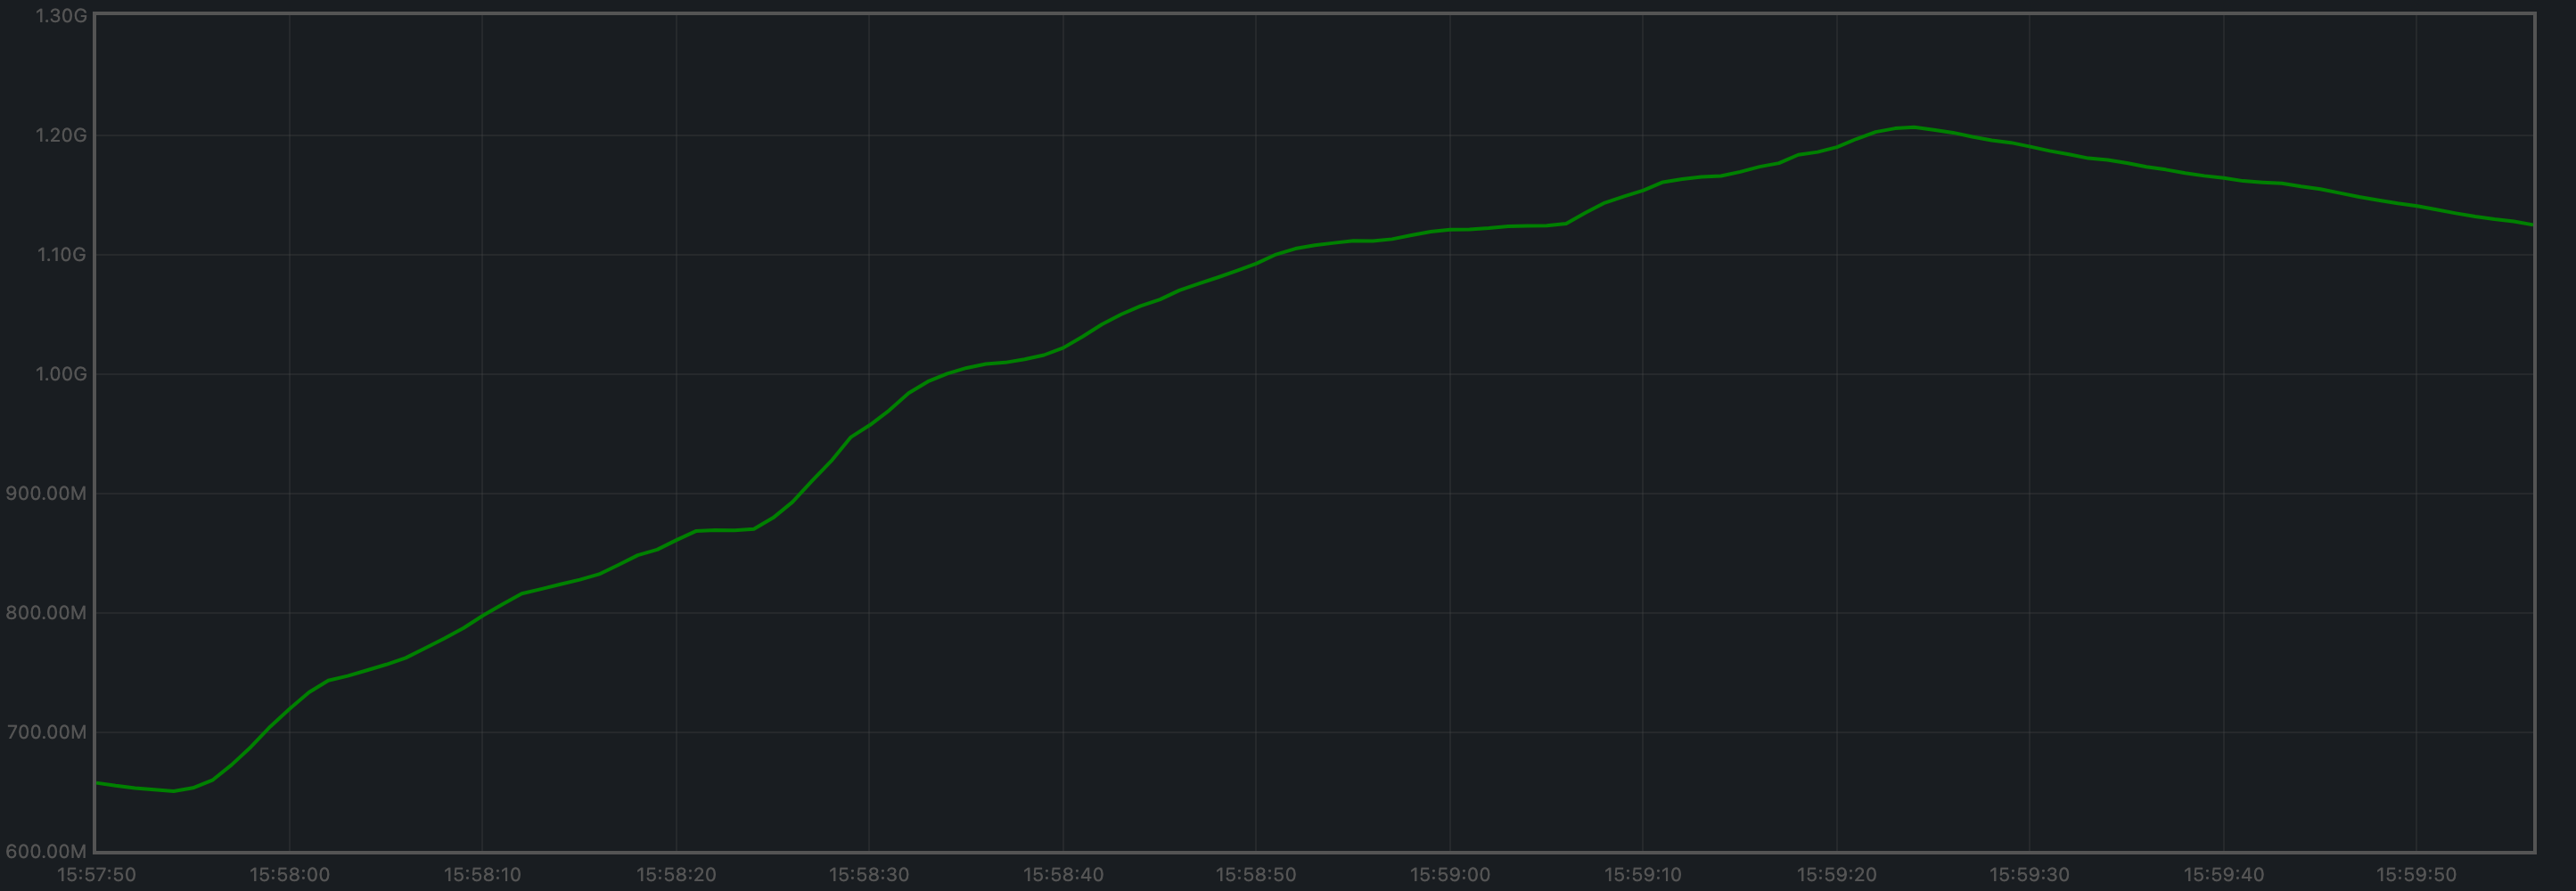
Blocks Produced per Minute, Transactions Processed per Minute
The blocks produced per minute are the gradient of this plot.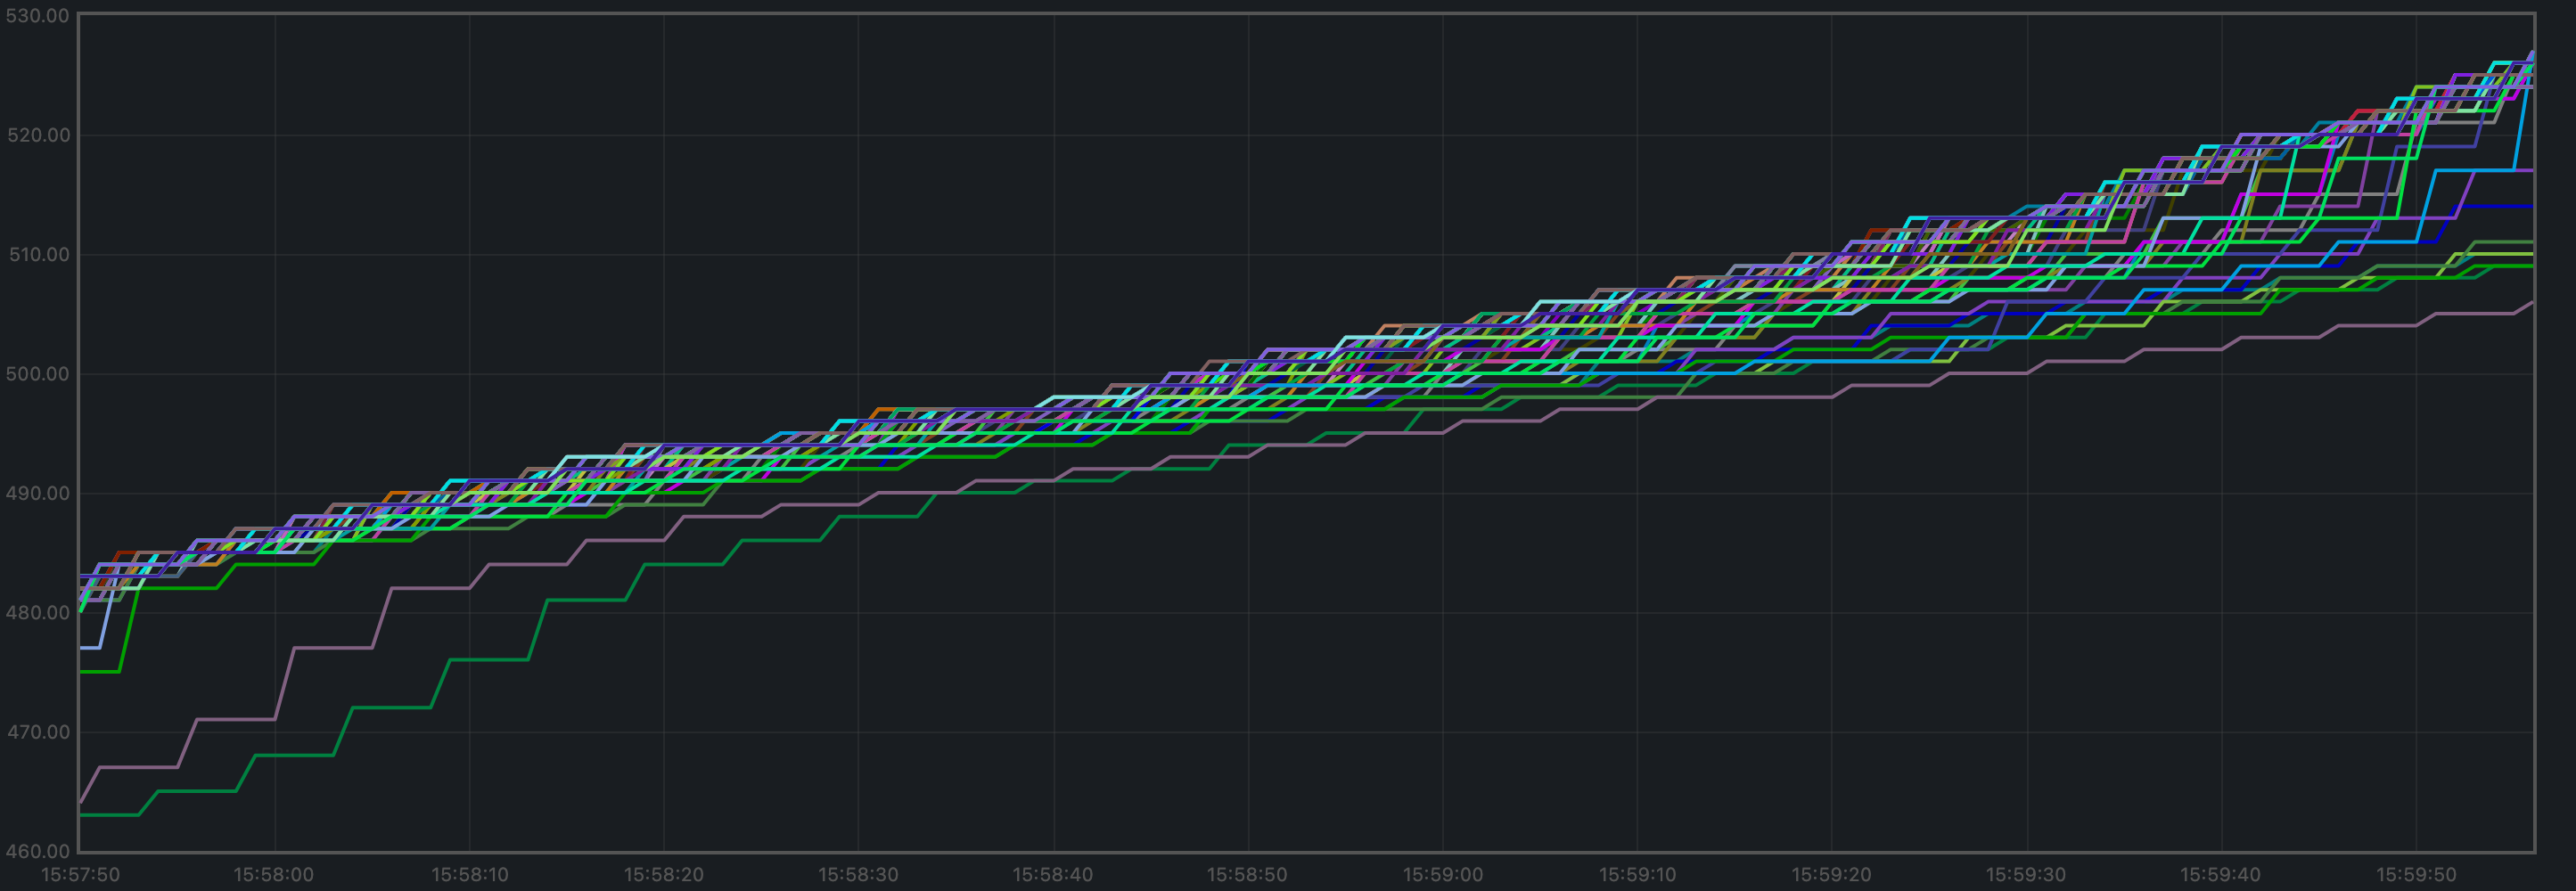
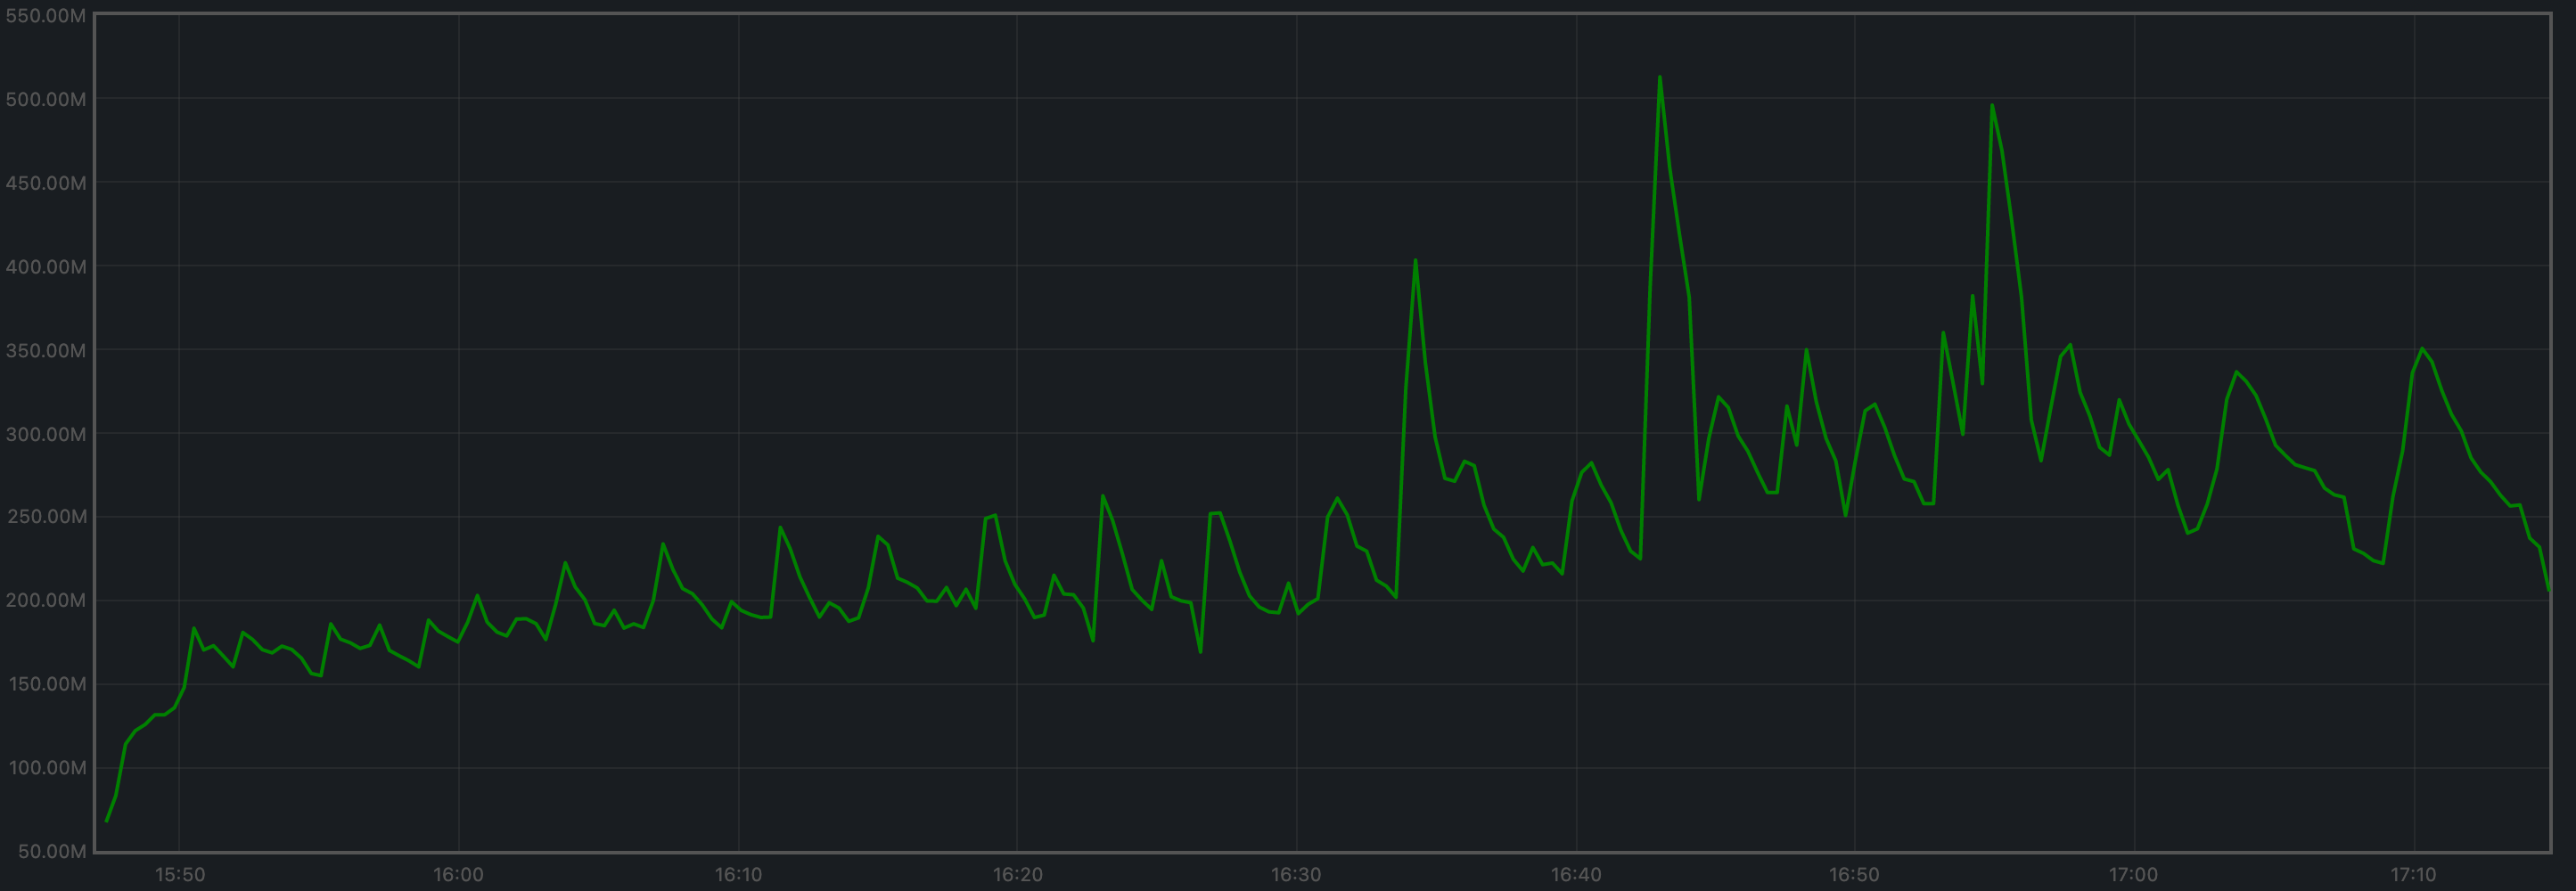
Memory Resident Set Size
Resident Set Size of all monitored processes is plotted below.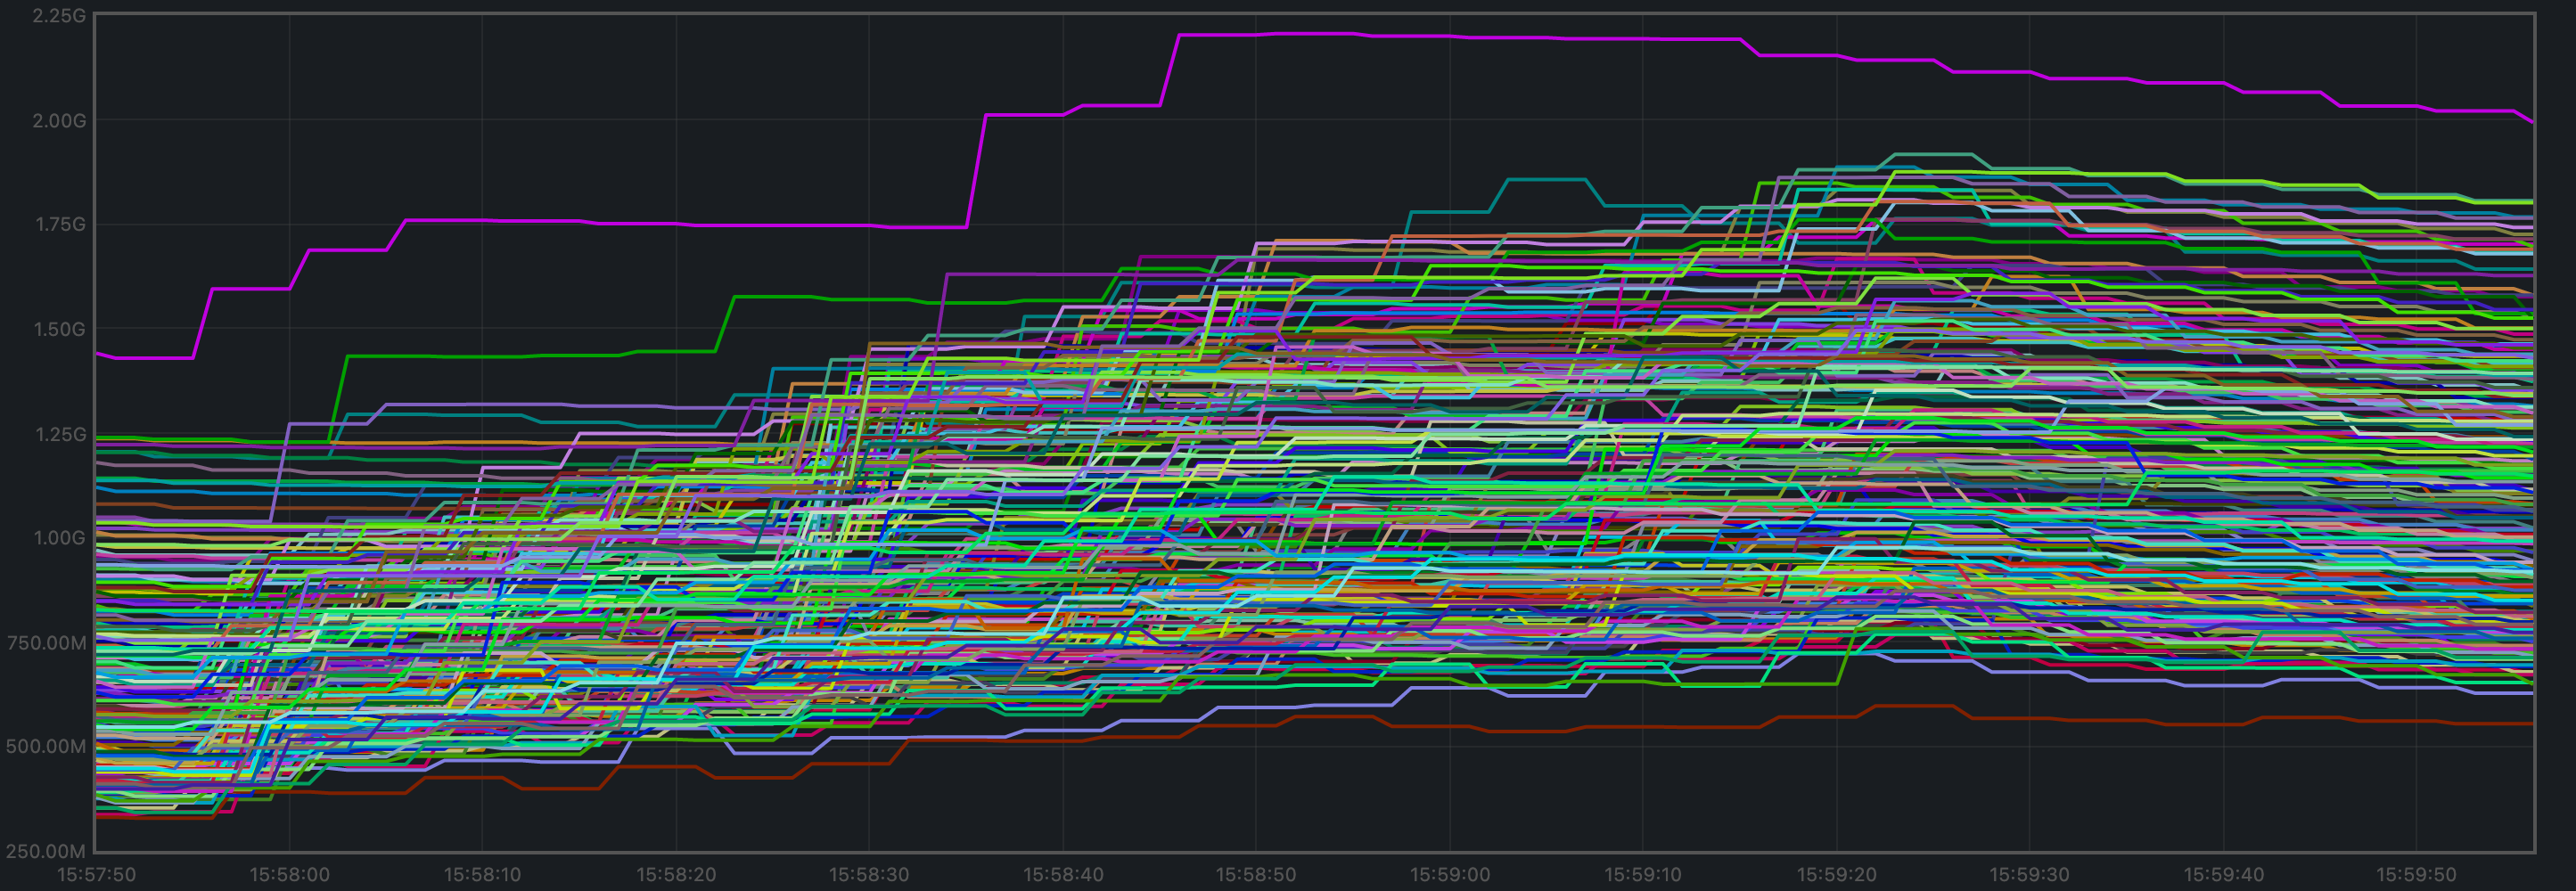
CPU Utilization
The best metric from Prometheus to gauge CPU utilization in a Unix machine isload1,
as it usually appears in the
output of top.
Test Result
Result: PASS Date: 2022-10-14 Version: 1cf9d8e276afe8595cba960b51cd056514965fd1Rotating Node Testnet
We use the same load as in the baseline:c=4,r=800.
Just as in the baseline tests, the version of CometBFT used for these tests is affected by #9539.
See this paragraph in the baseline report for further details.
Finally, note that this setup allows for a fairer comparison between this version and the baseline.
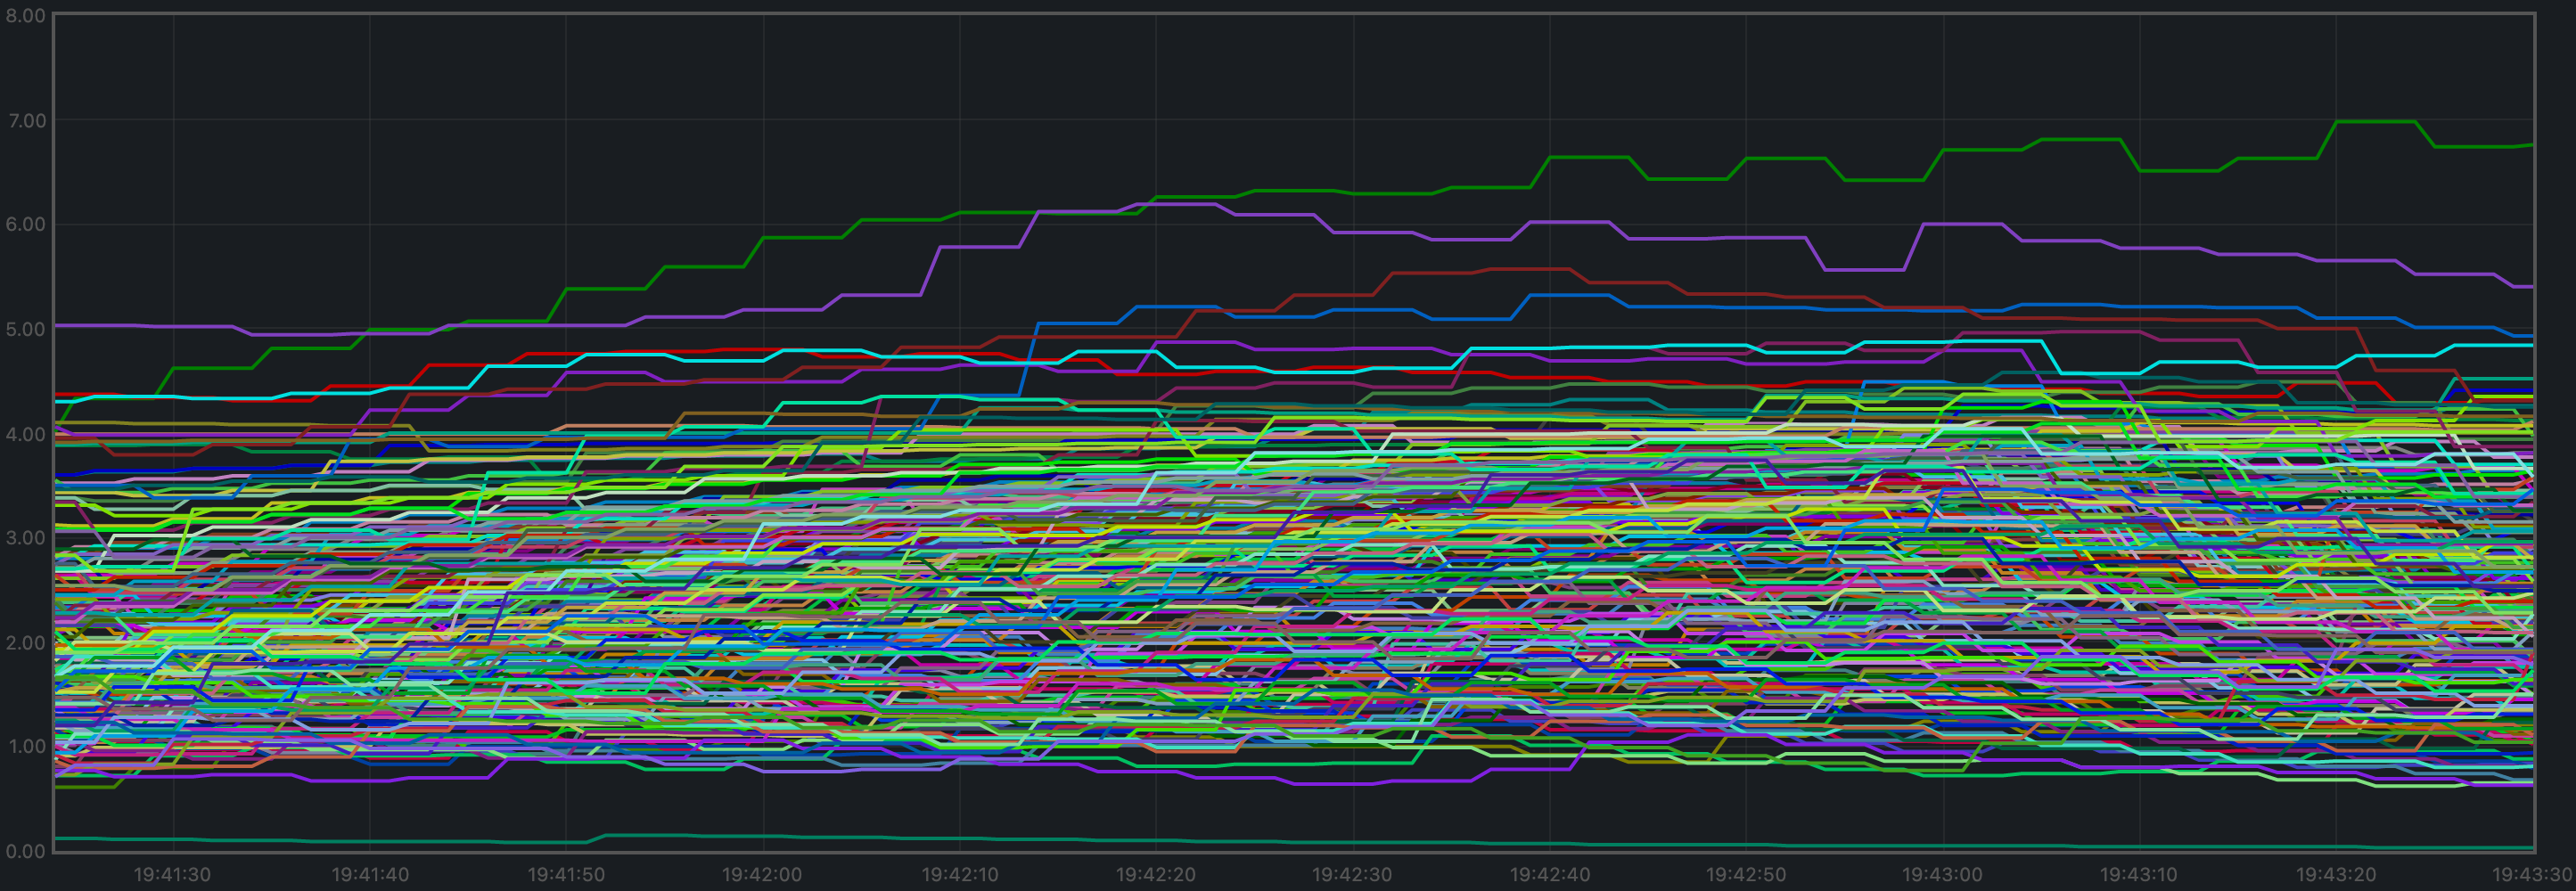
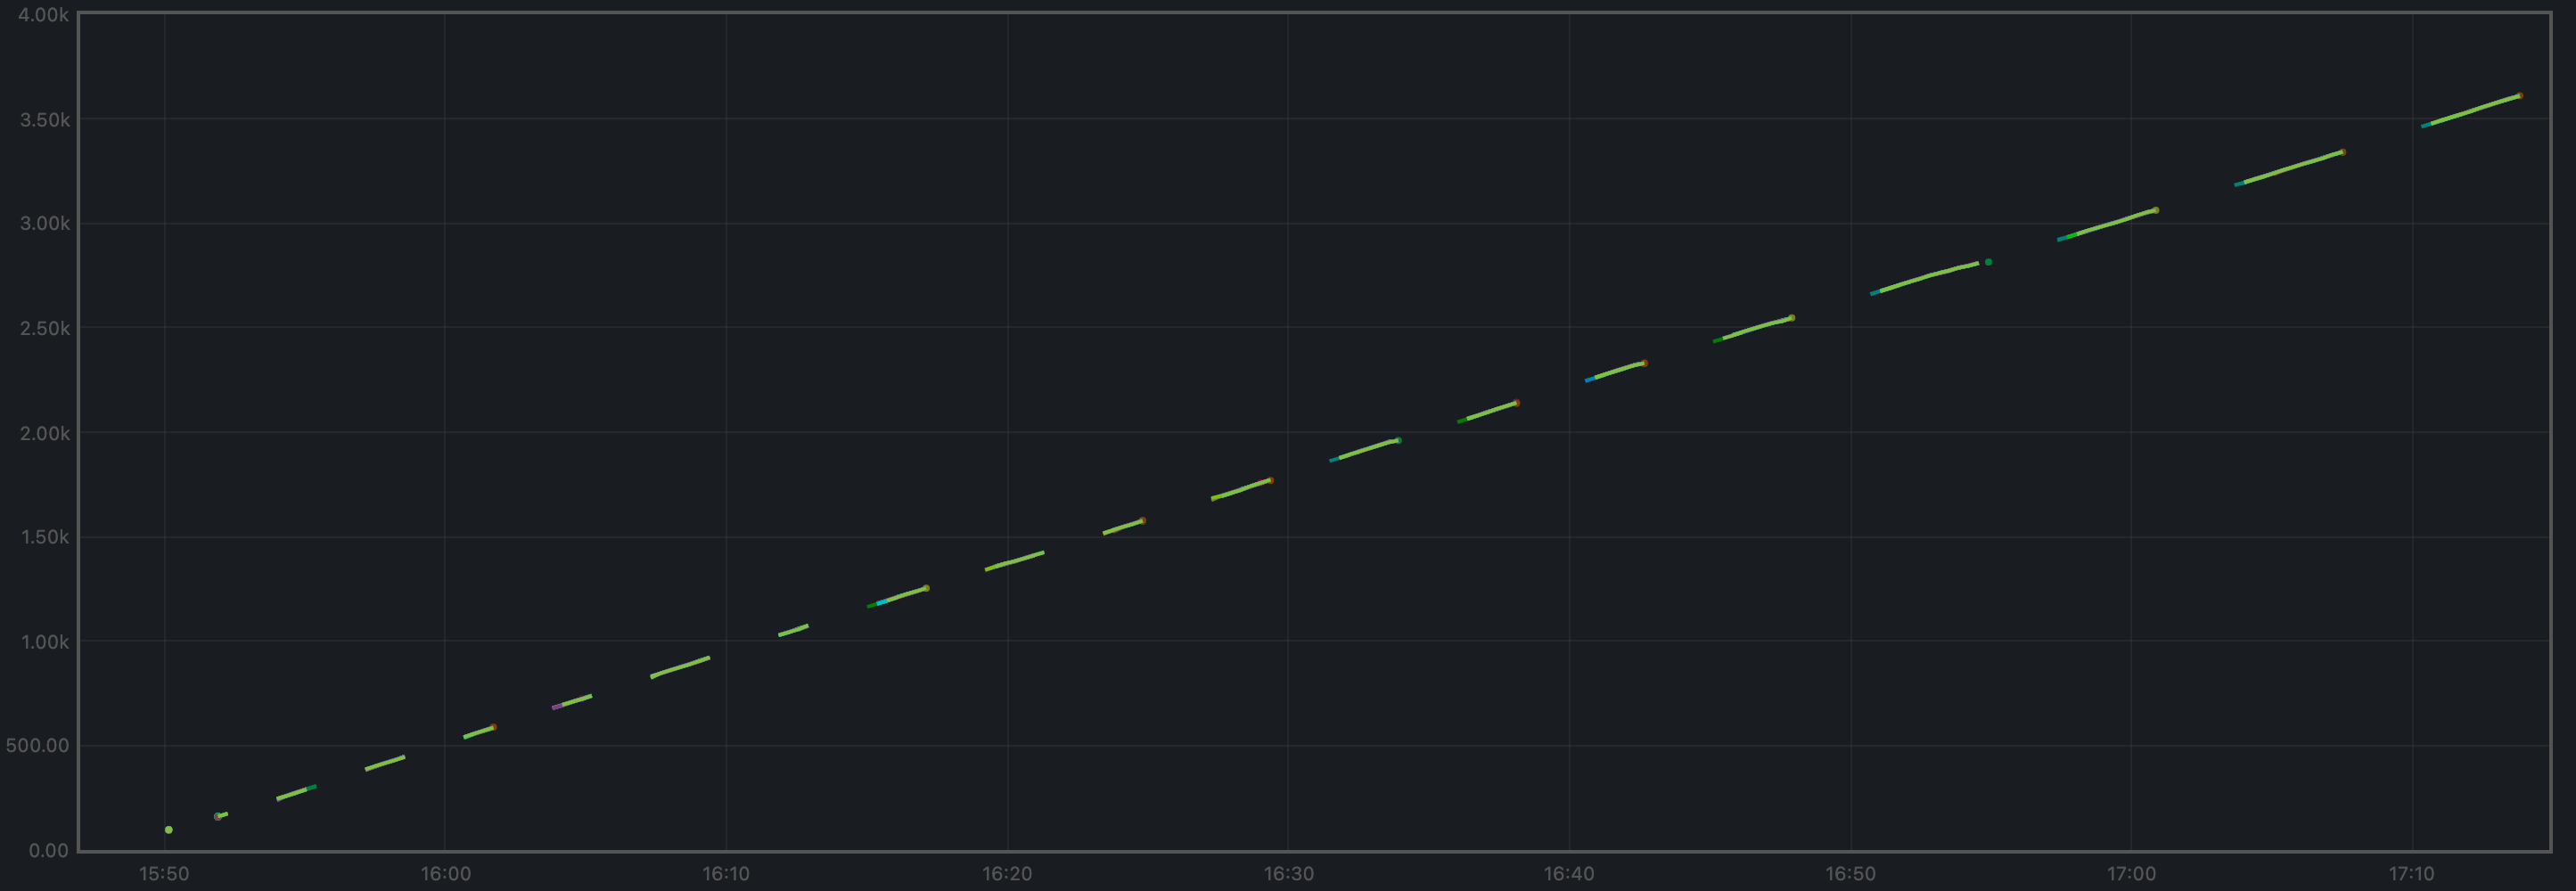
Latencies
The plot of all latencies can be seen here.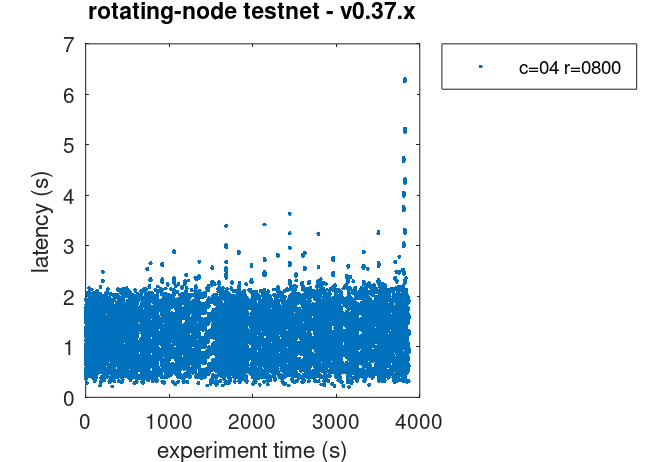
v0.37,
which is not proof that the problem is not present in v0.37.
Prometheus Metrics
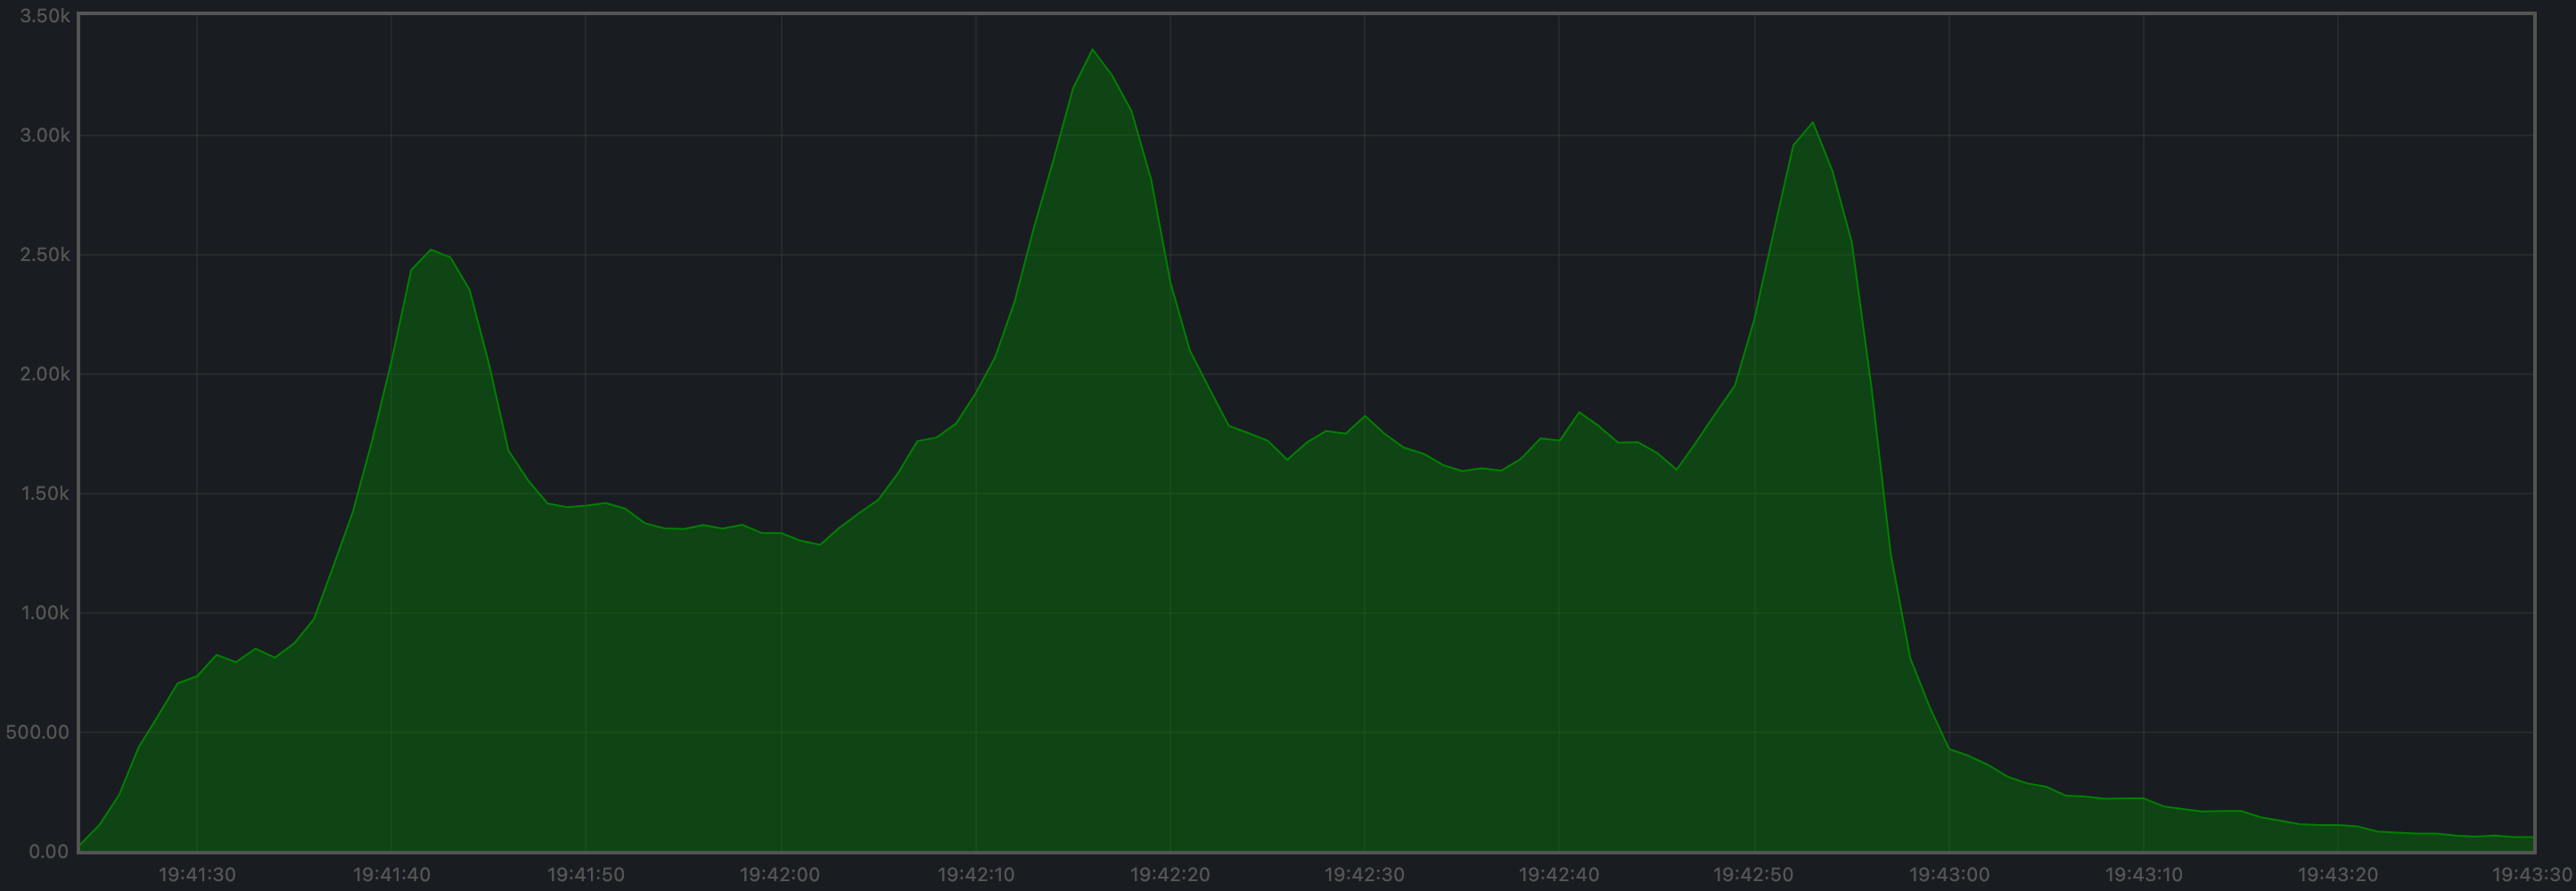
The set of metrics shown here match those shown on the baseline (v0.34) for the same experiment.
We also show the baseline results for comparison.
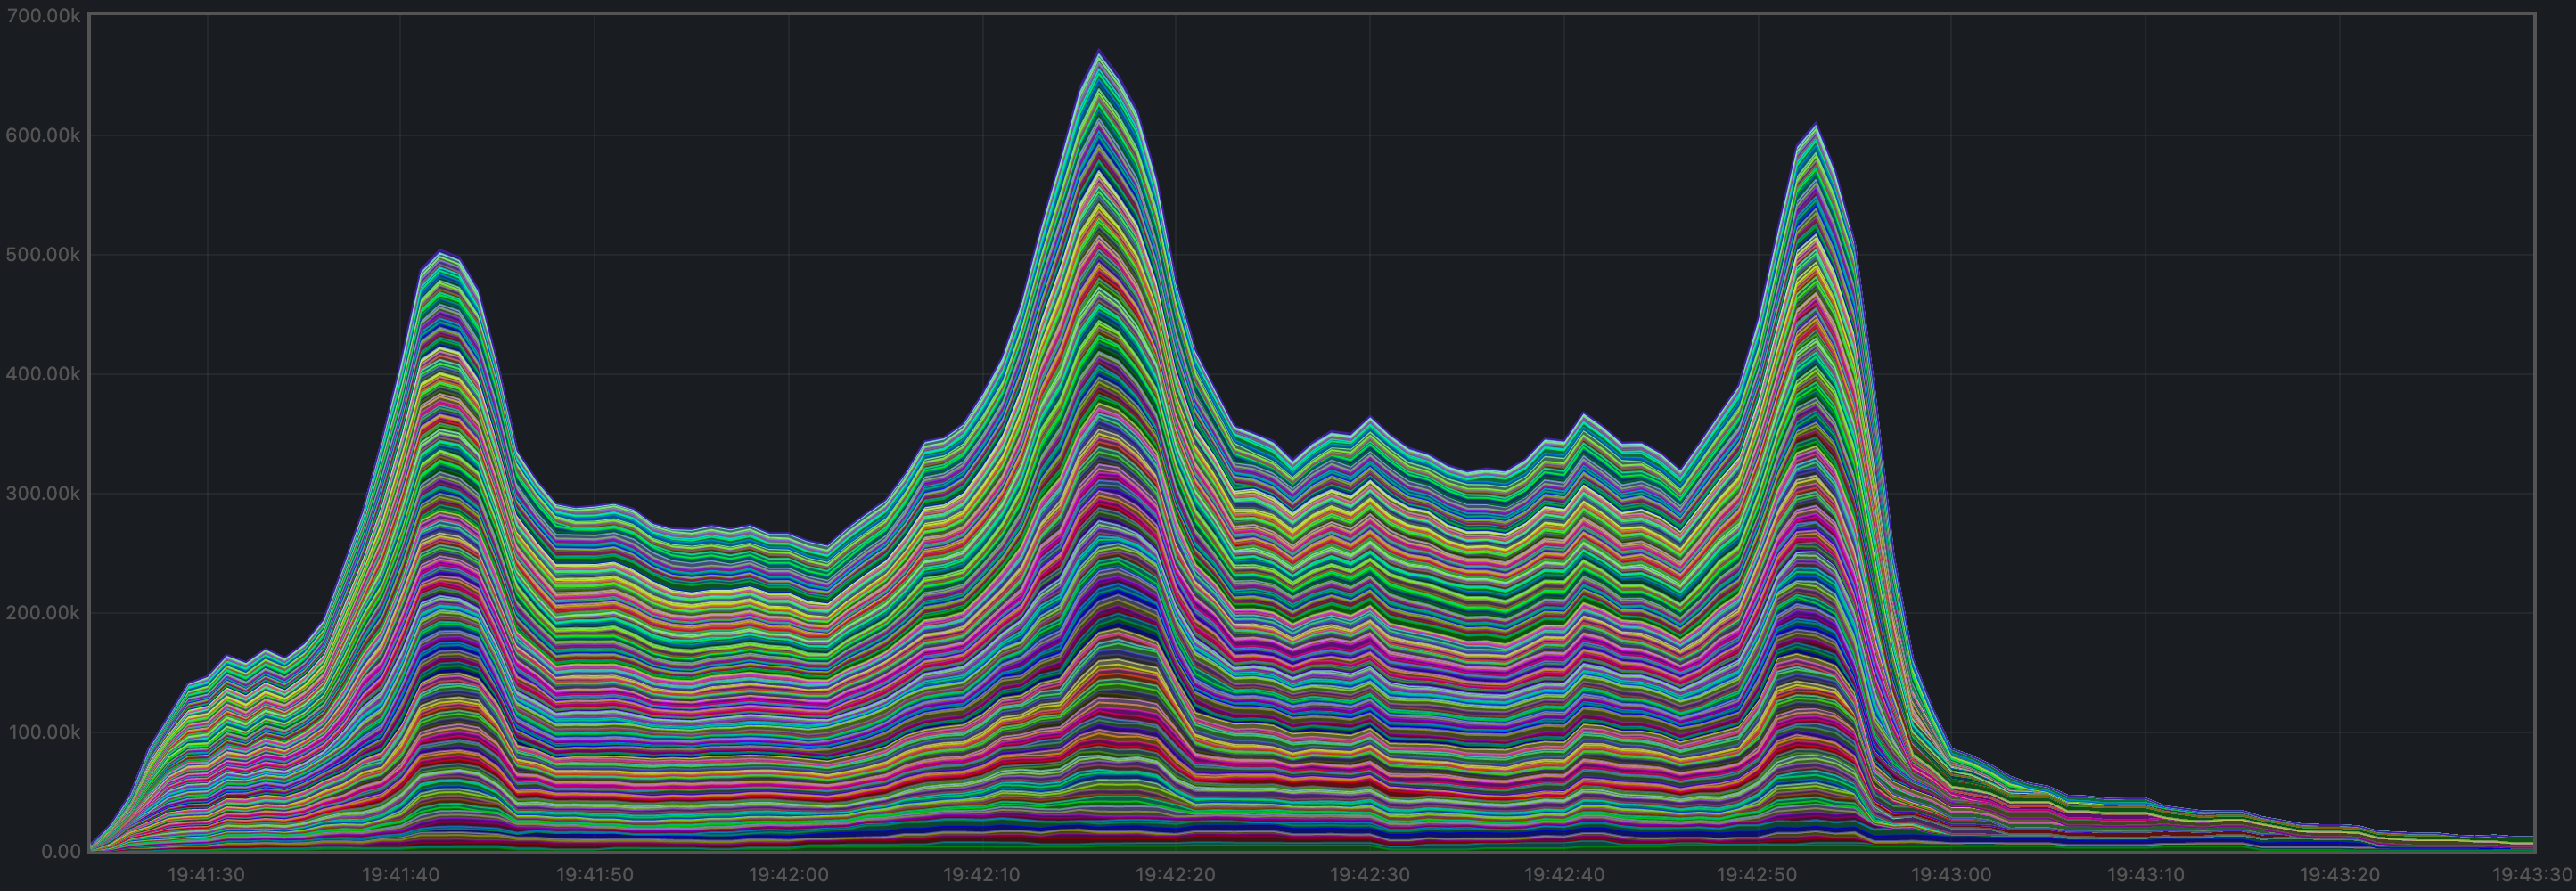
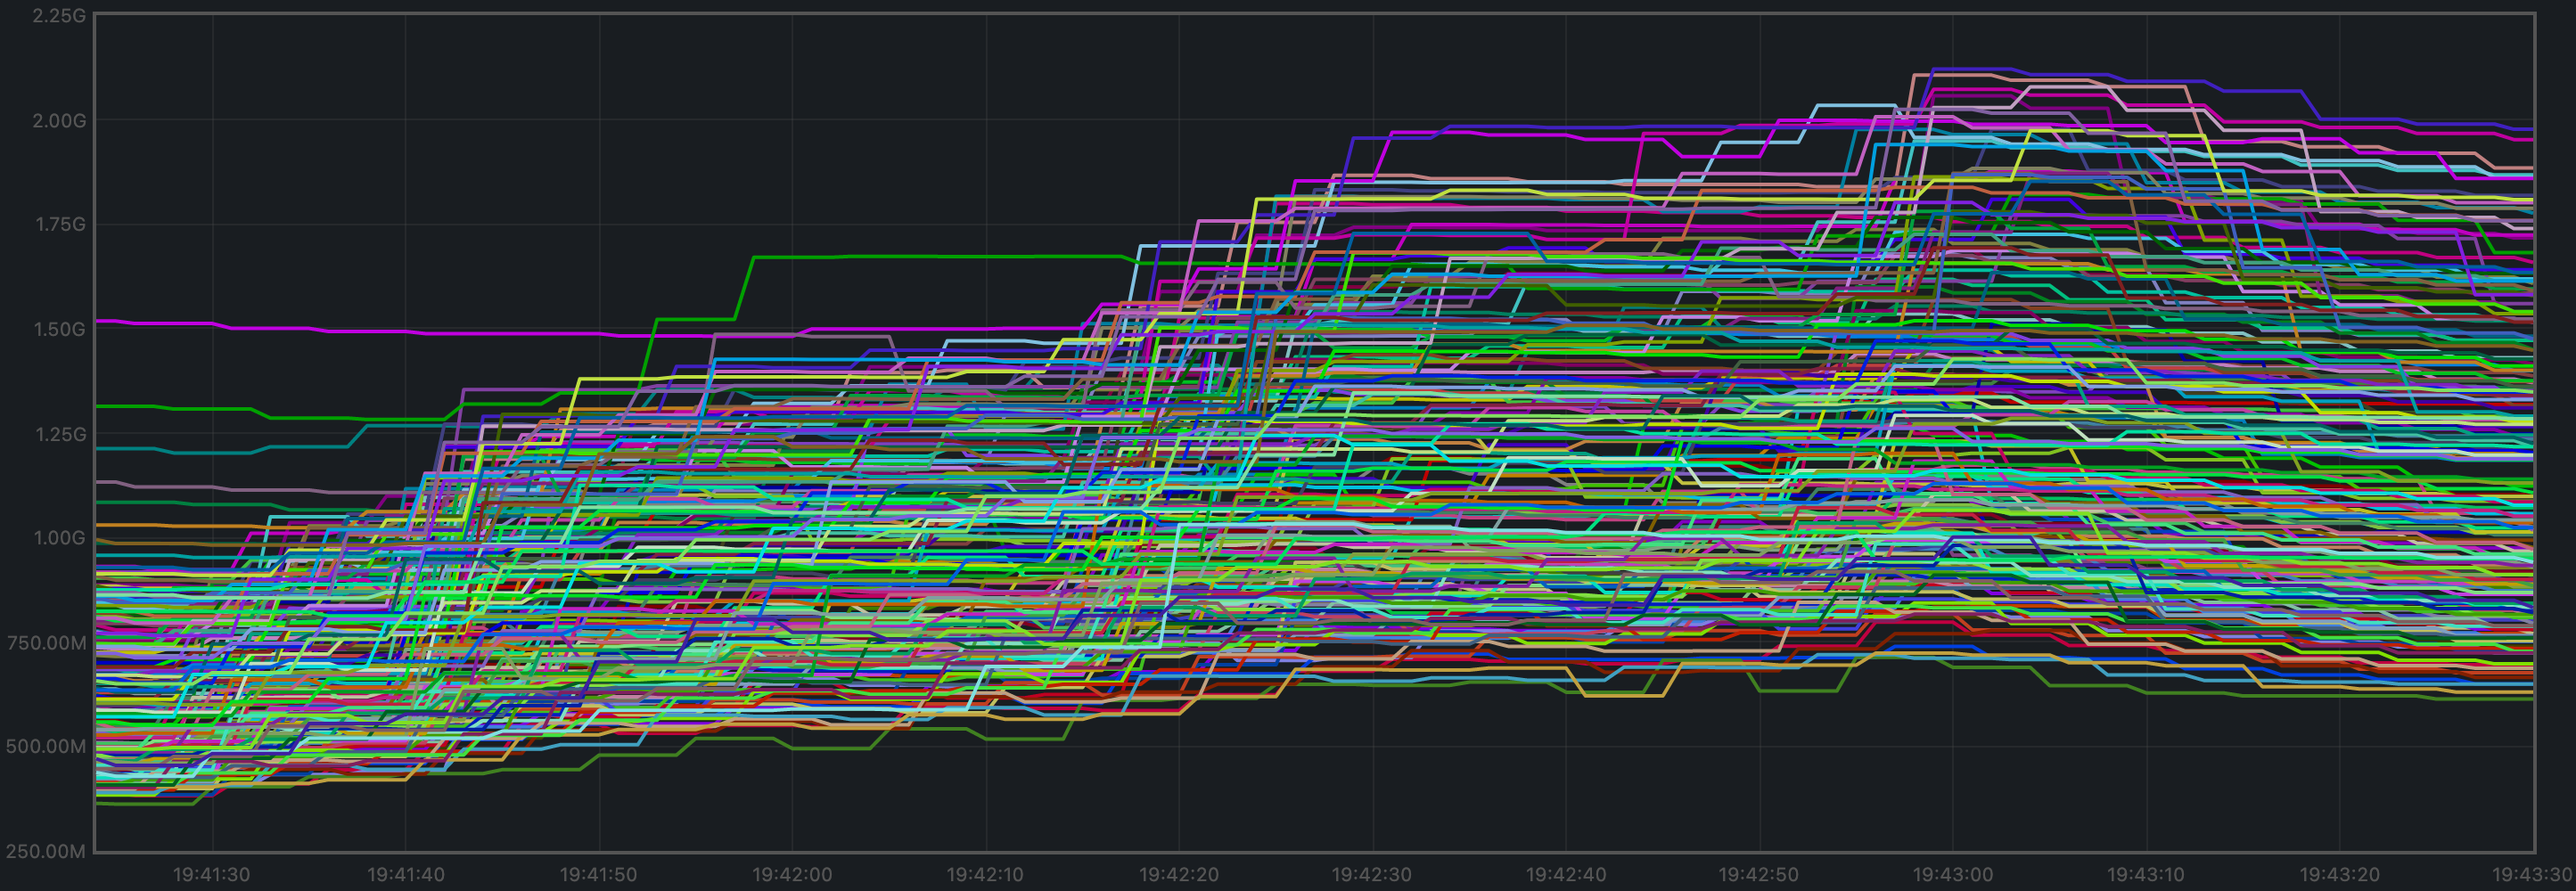
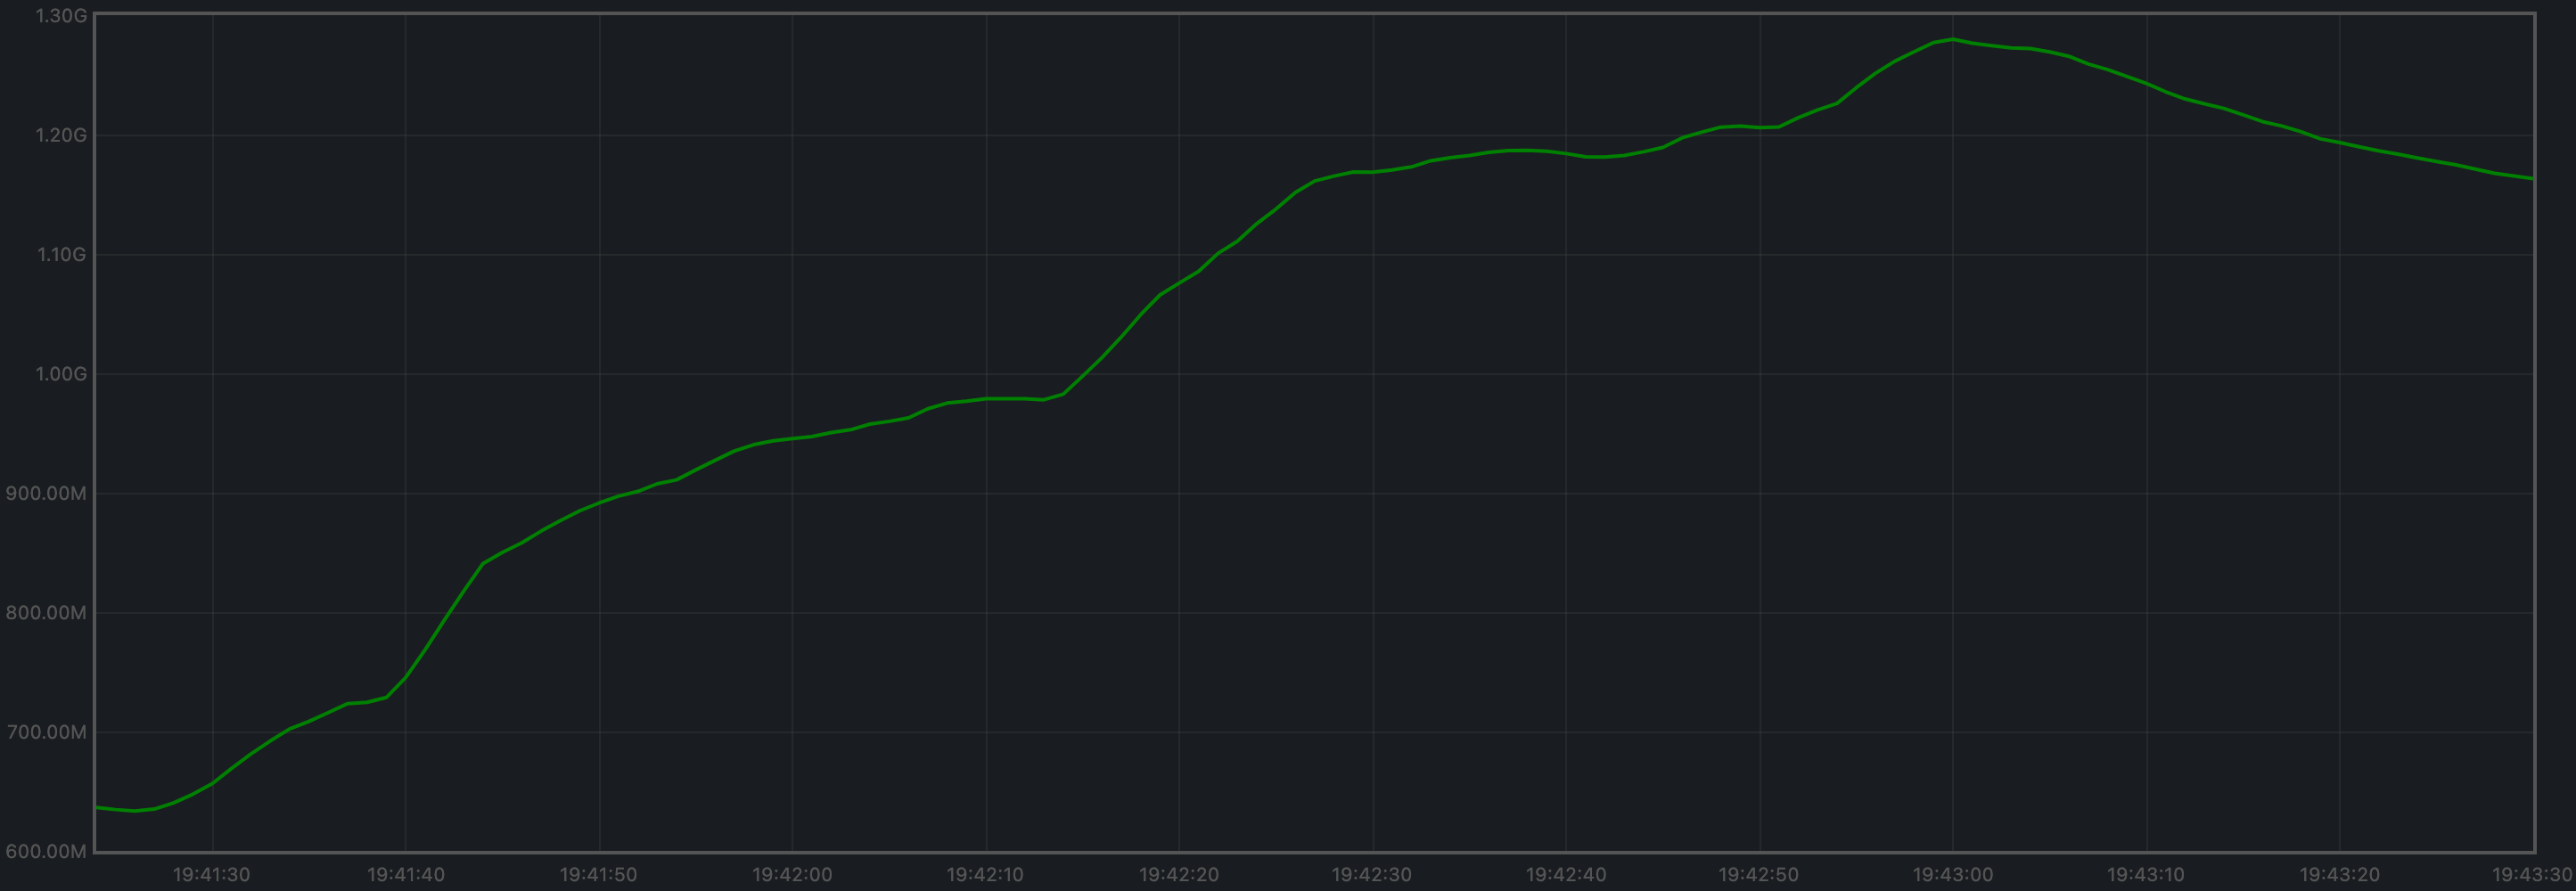
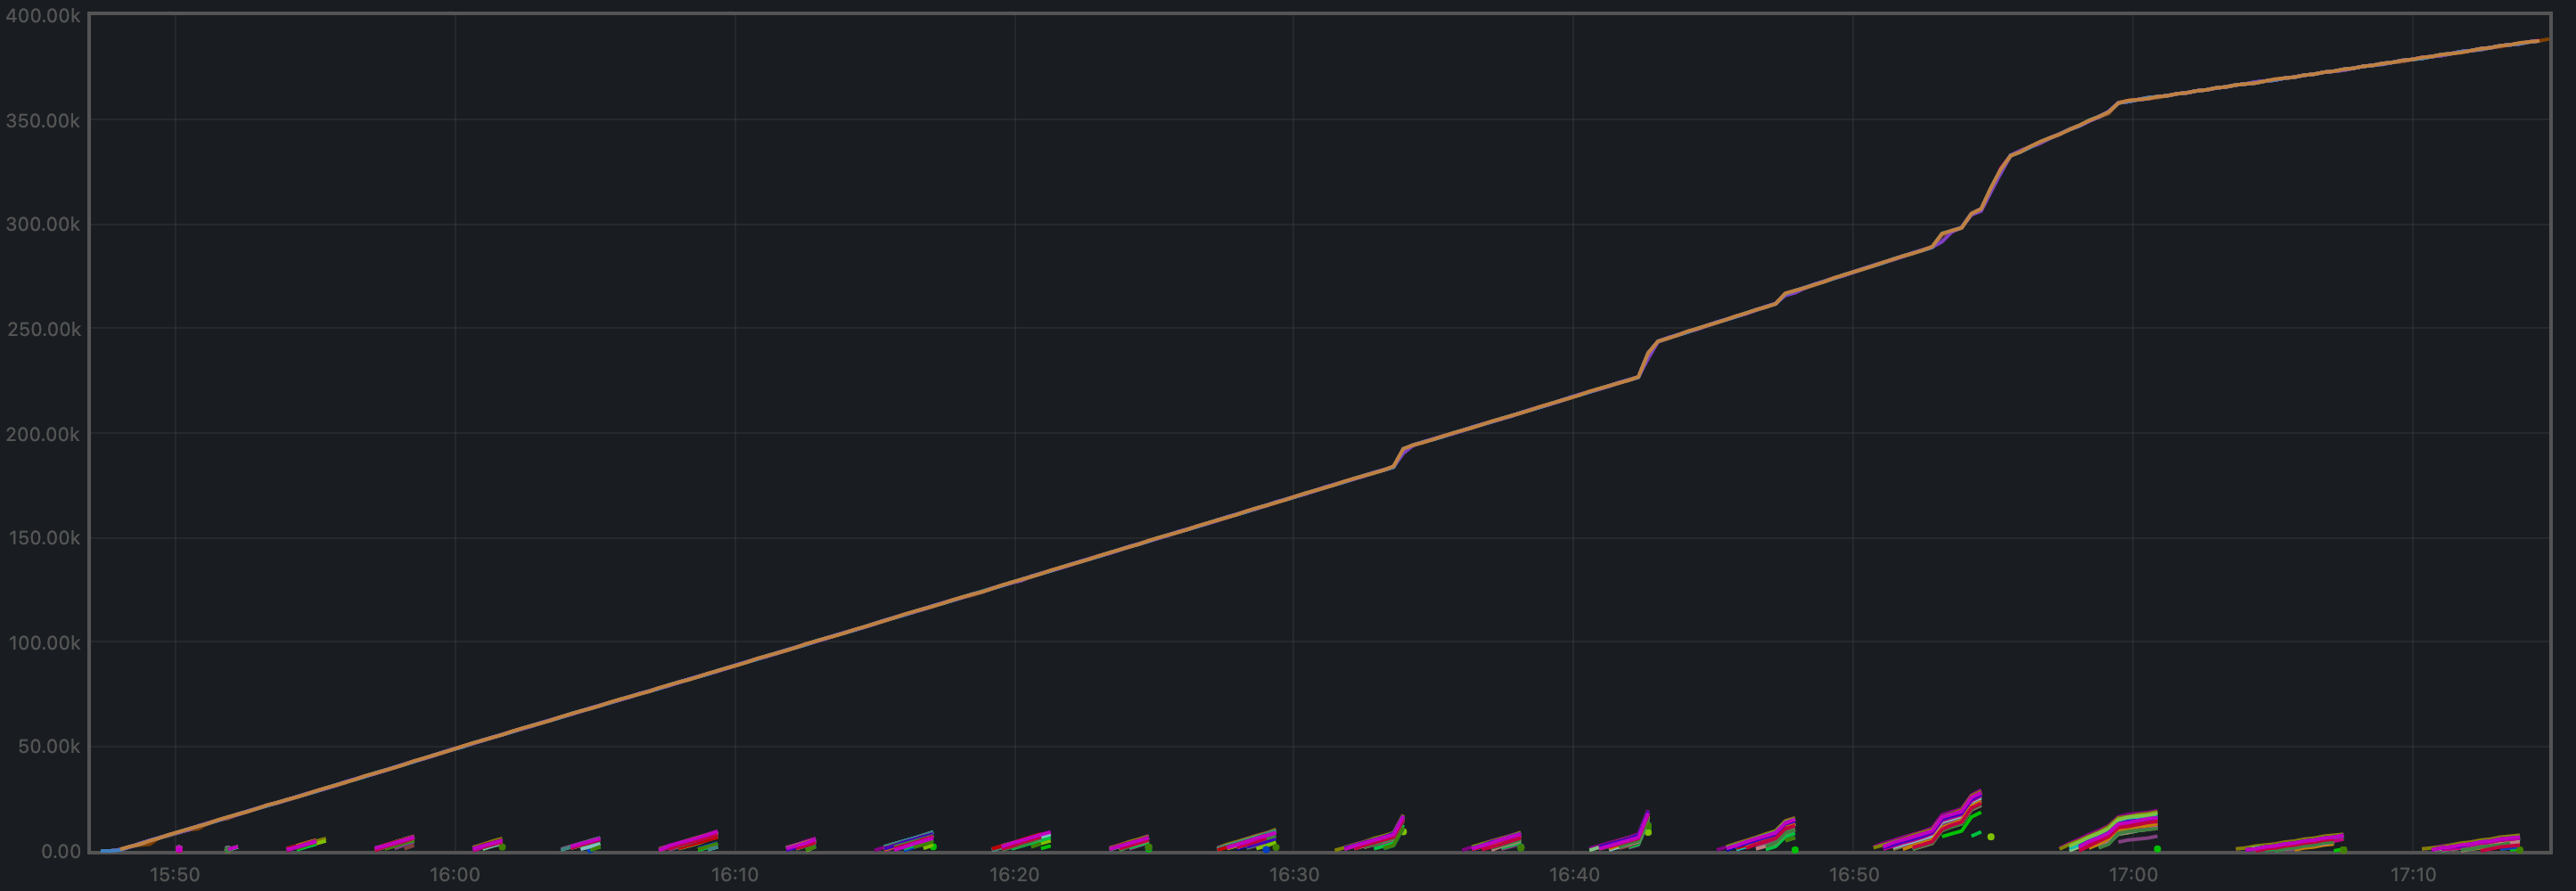
Blocks and Transactions per Minute
The blocks produced per minute are the gradient of this plot.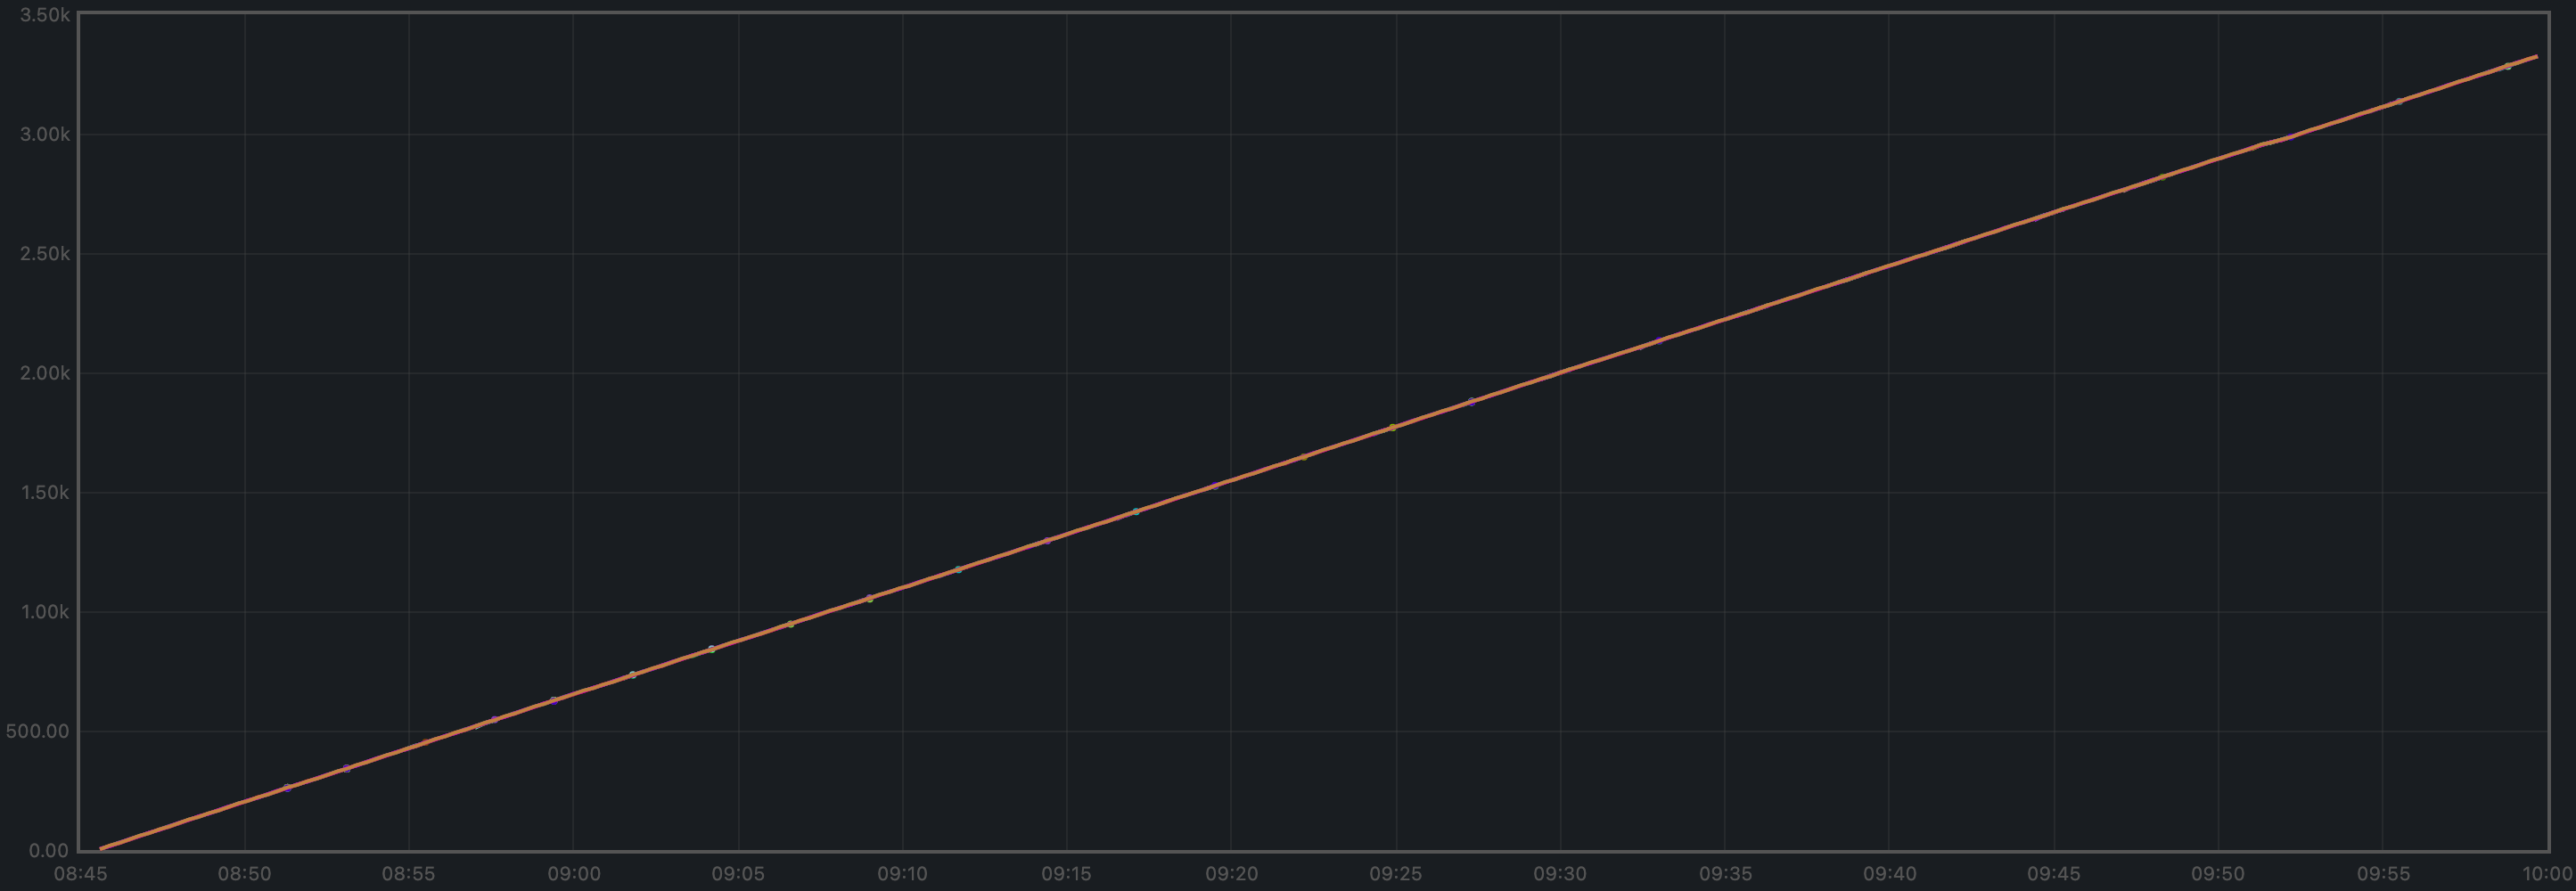
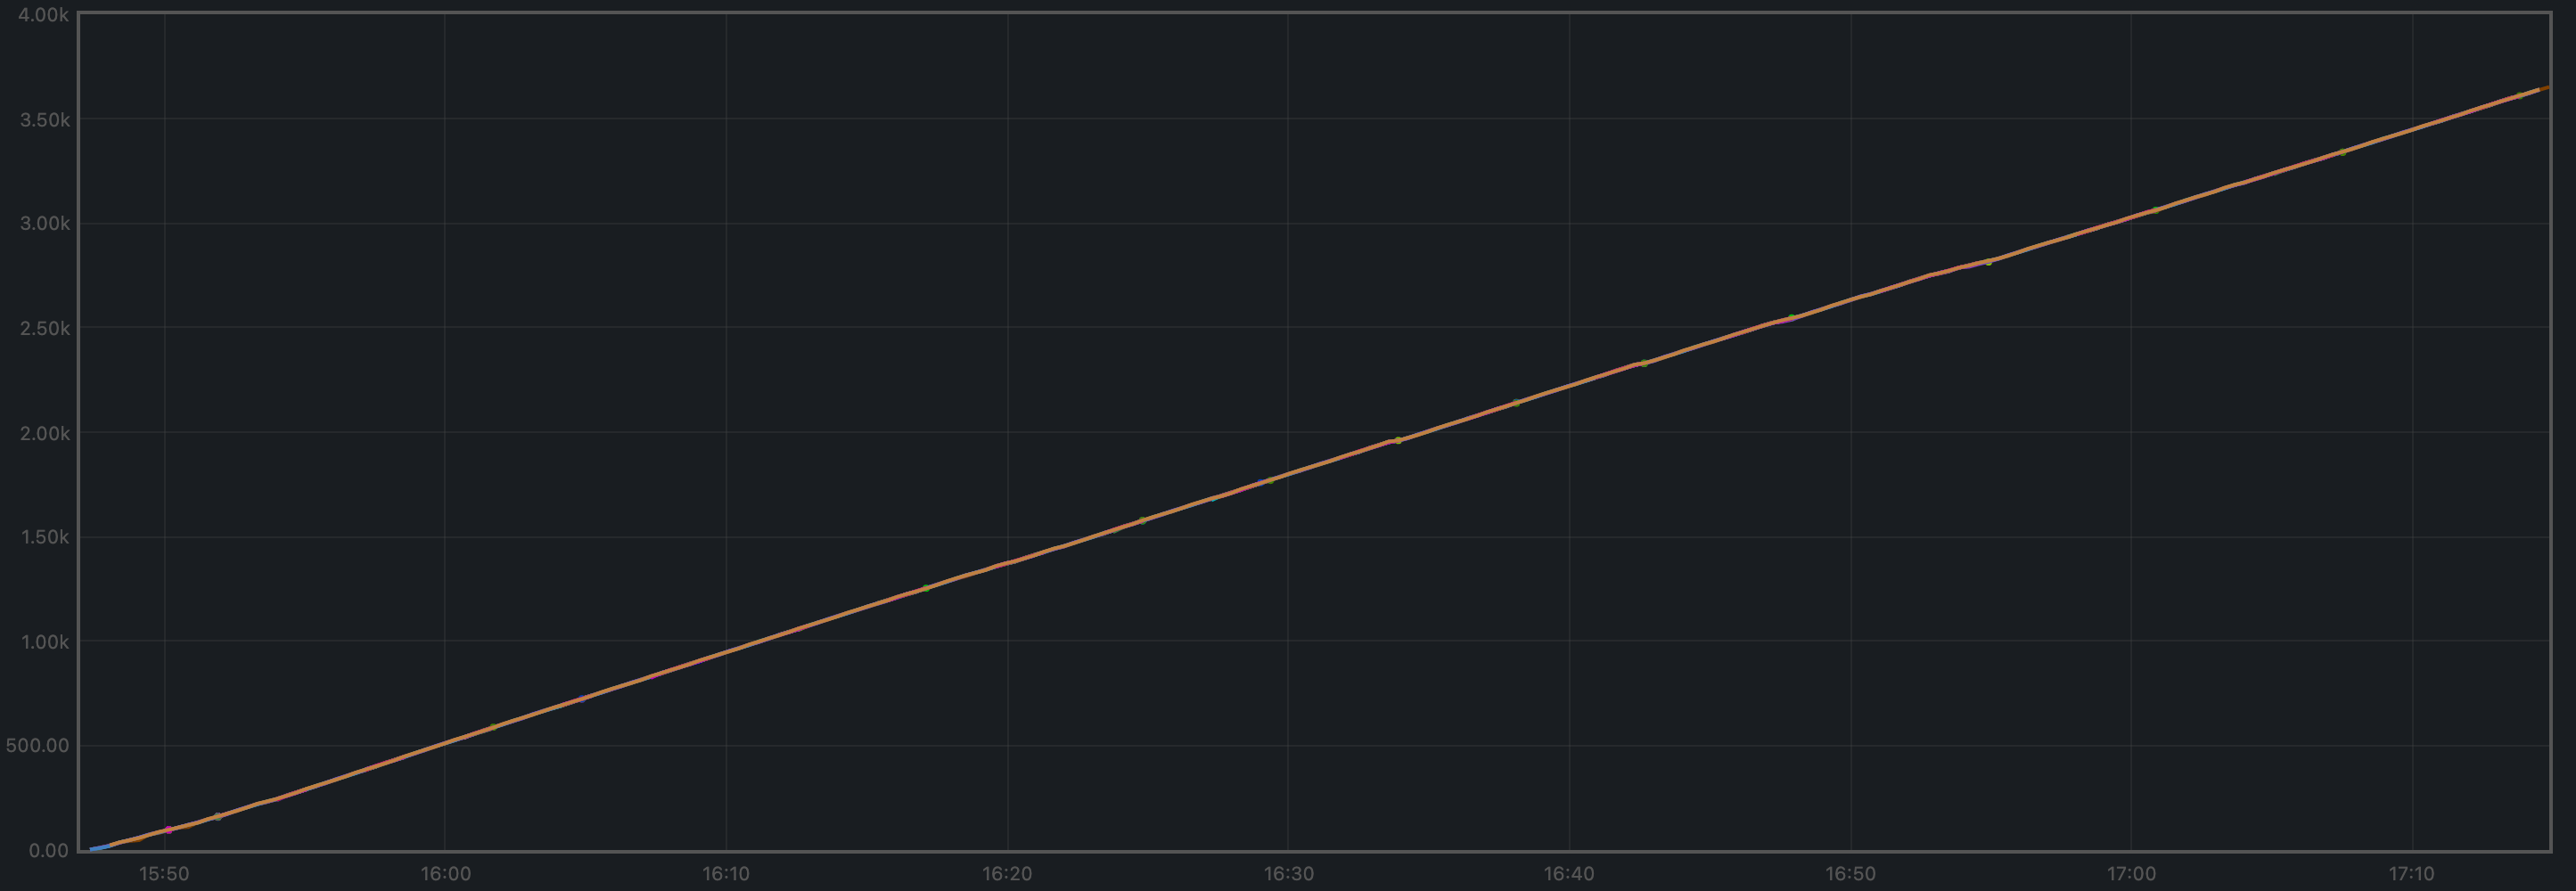
v0.37
catch up slightly faster.
The transactions processed per minute are the gradient of this plot.
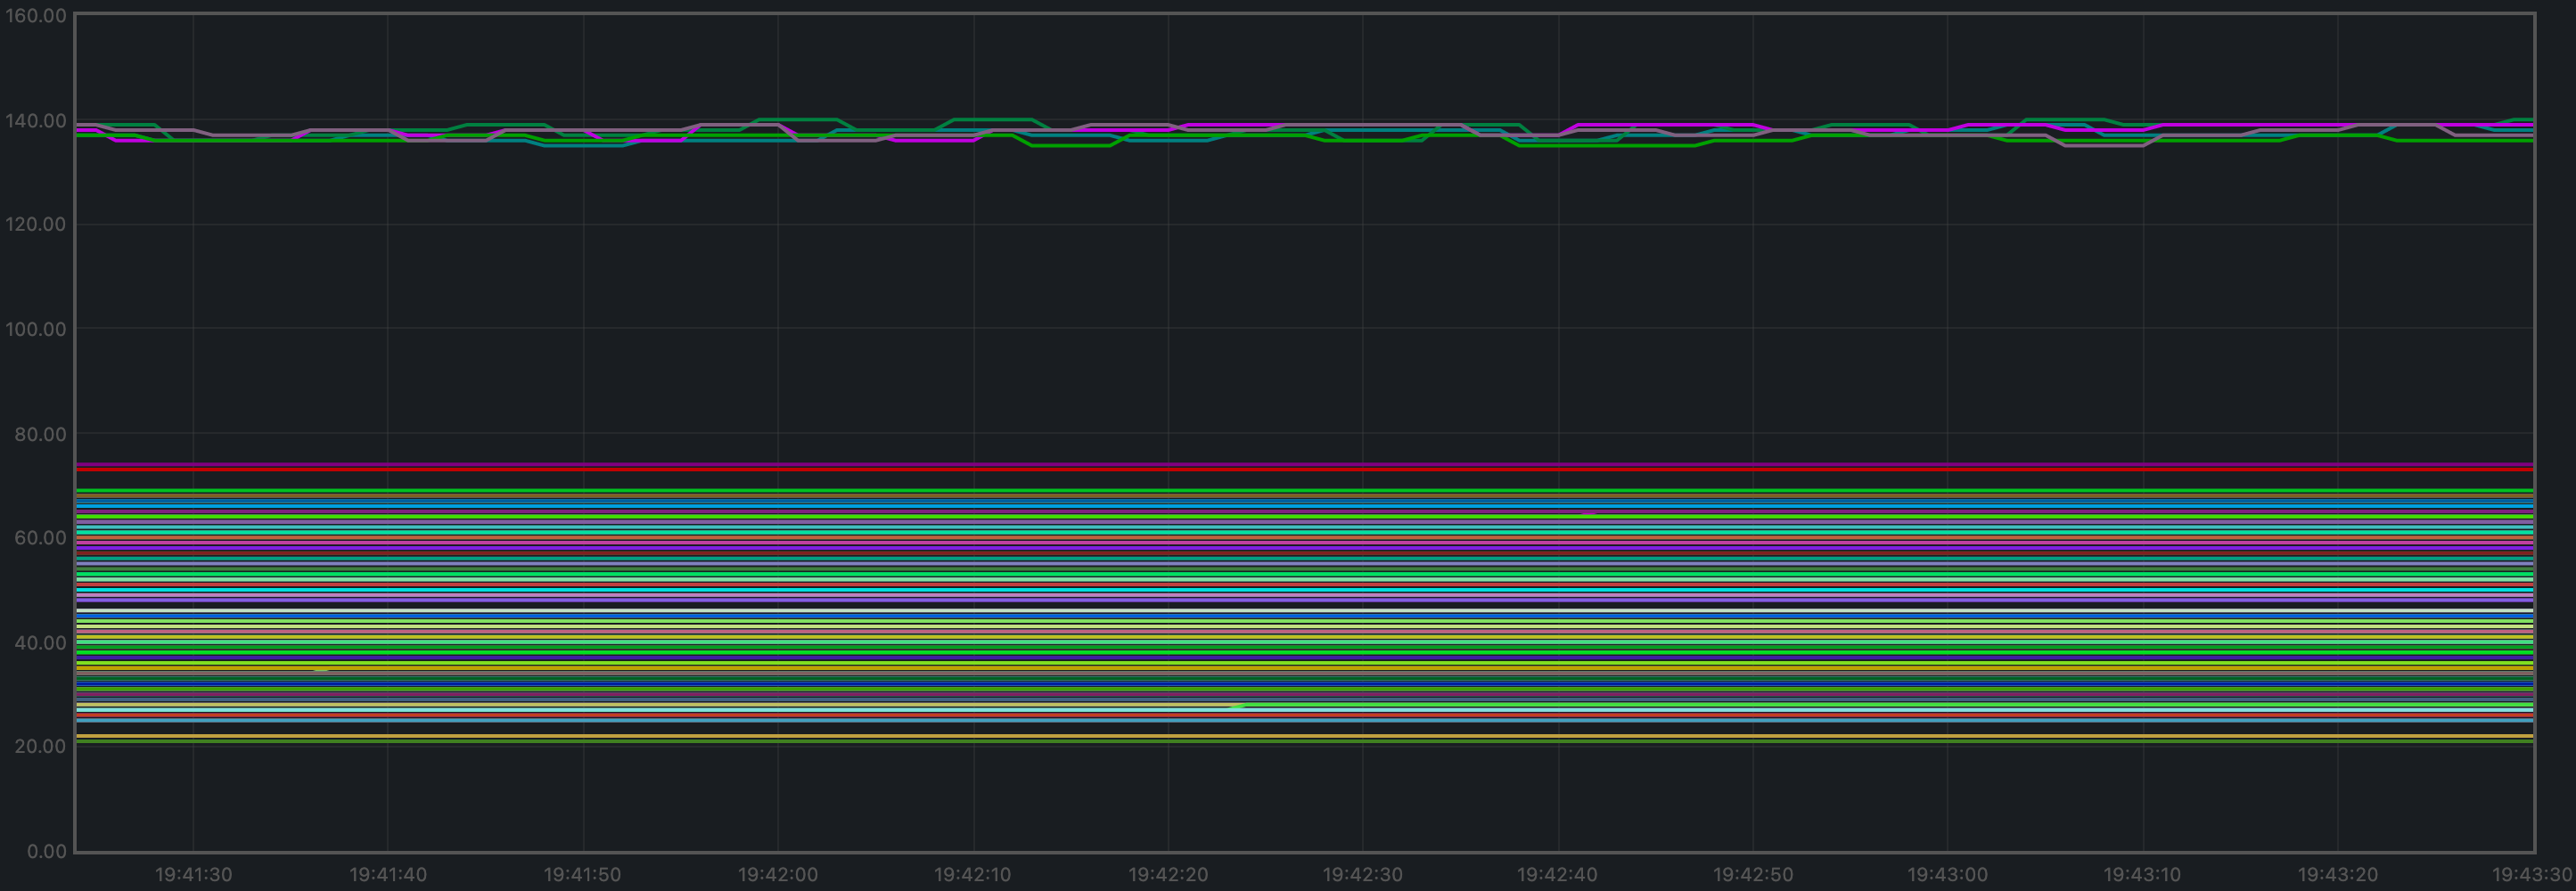
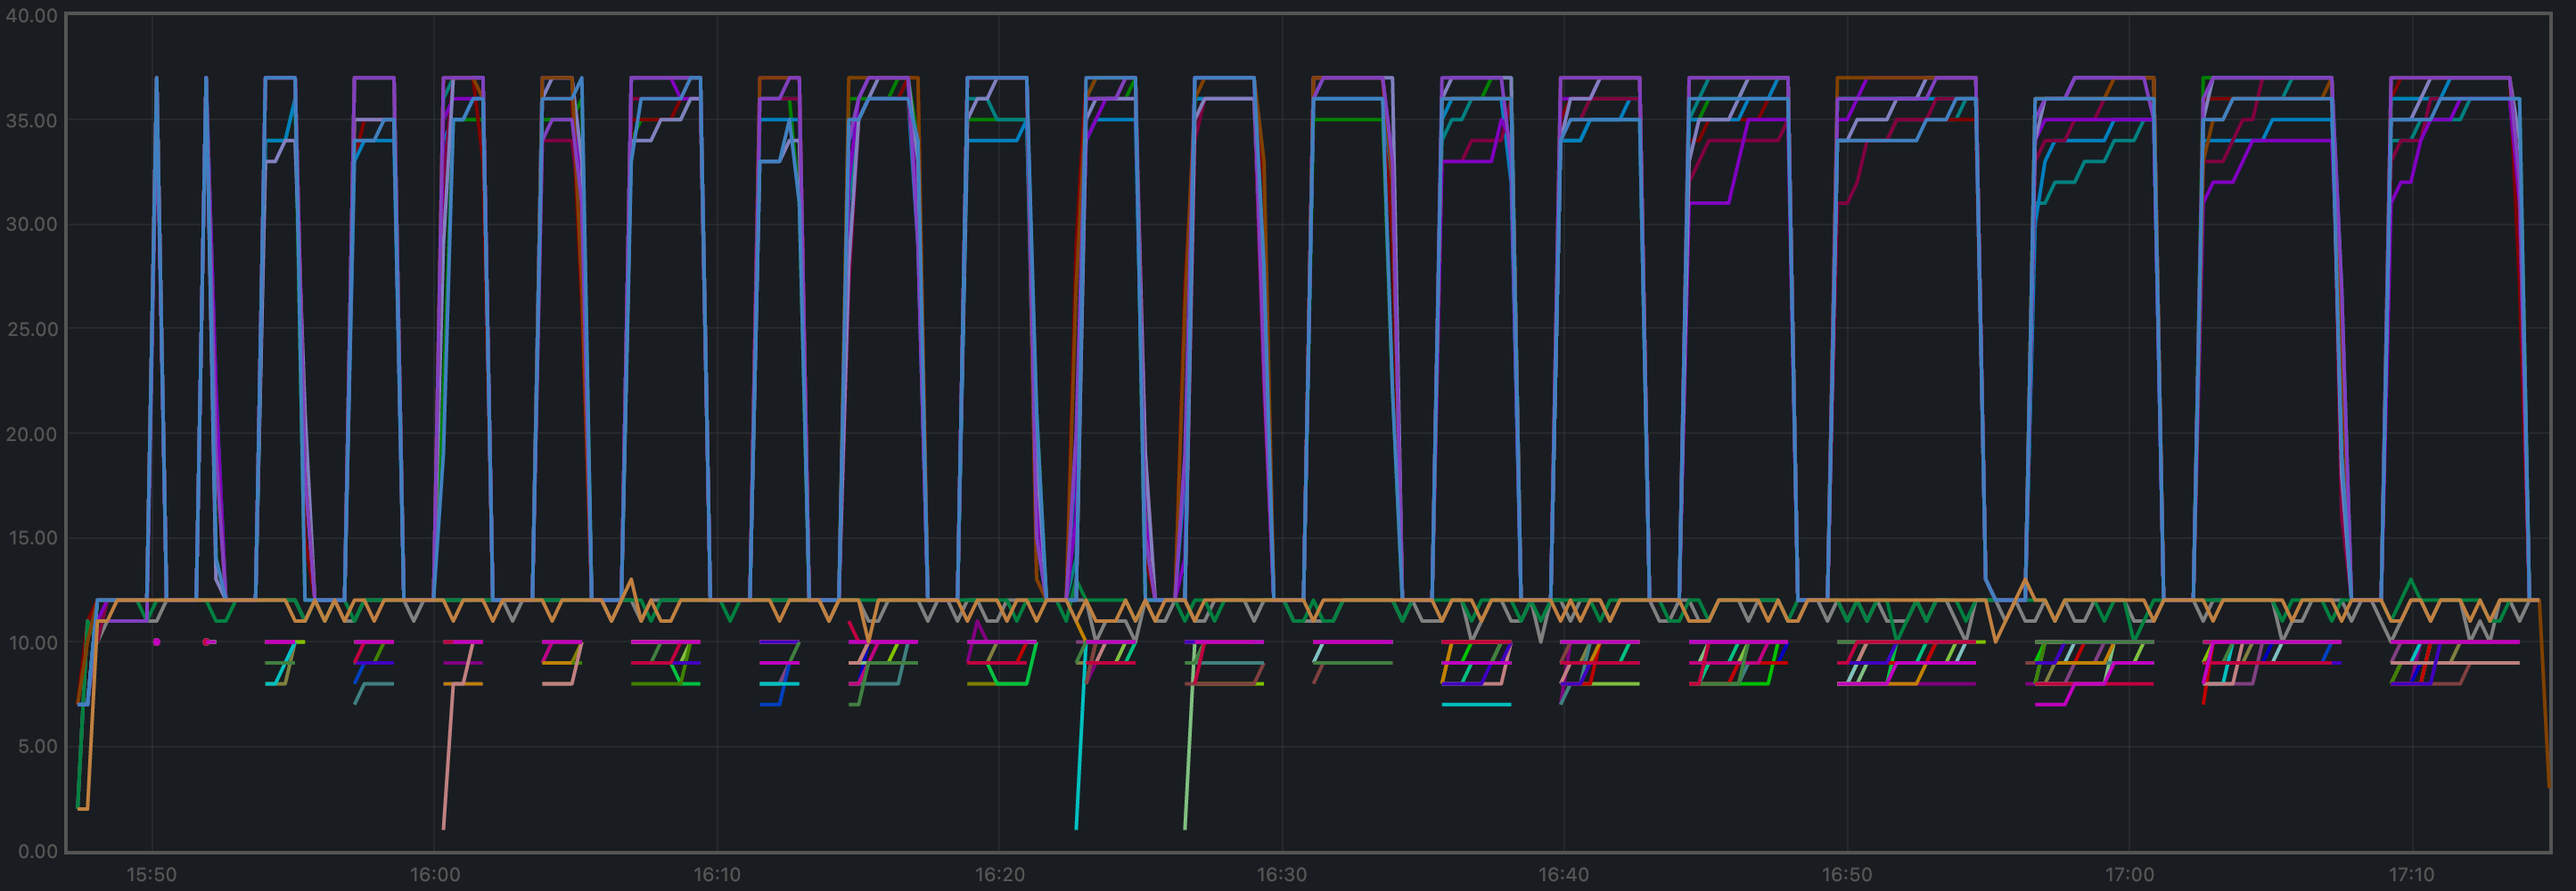
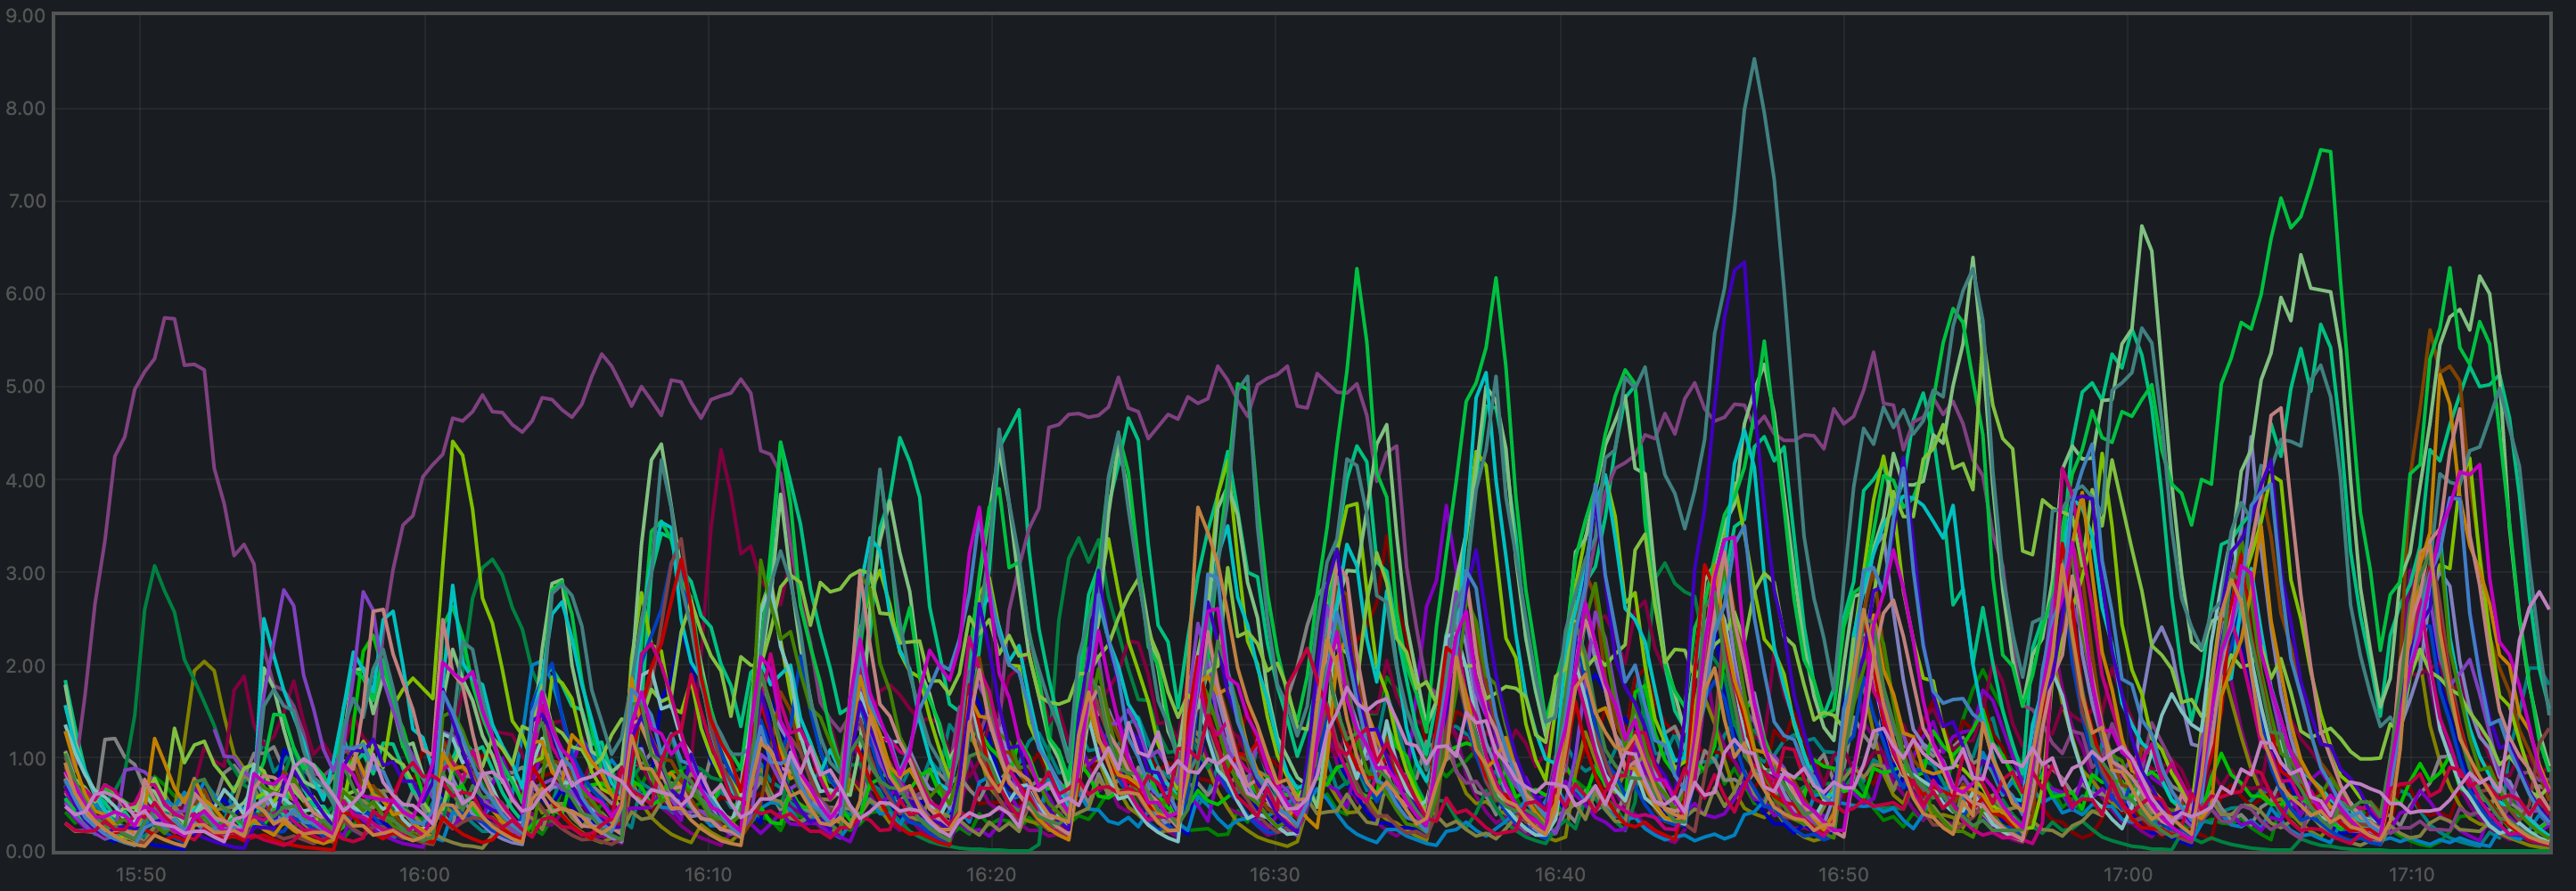
Peers
The plot below shows the evolution of the number of peers throughout the experiment.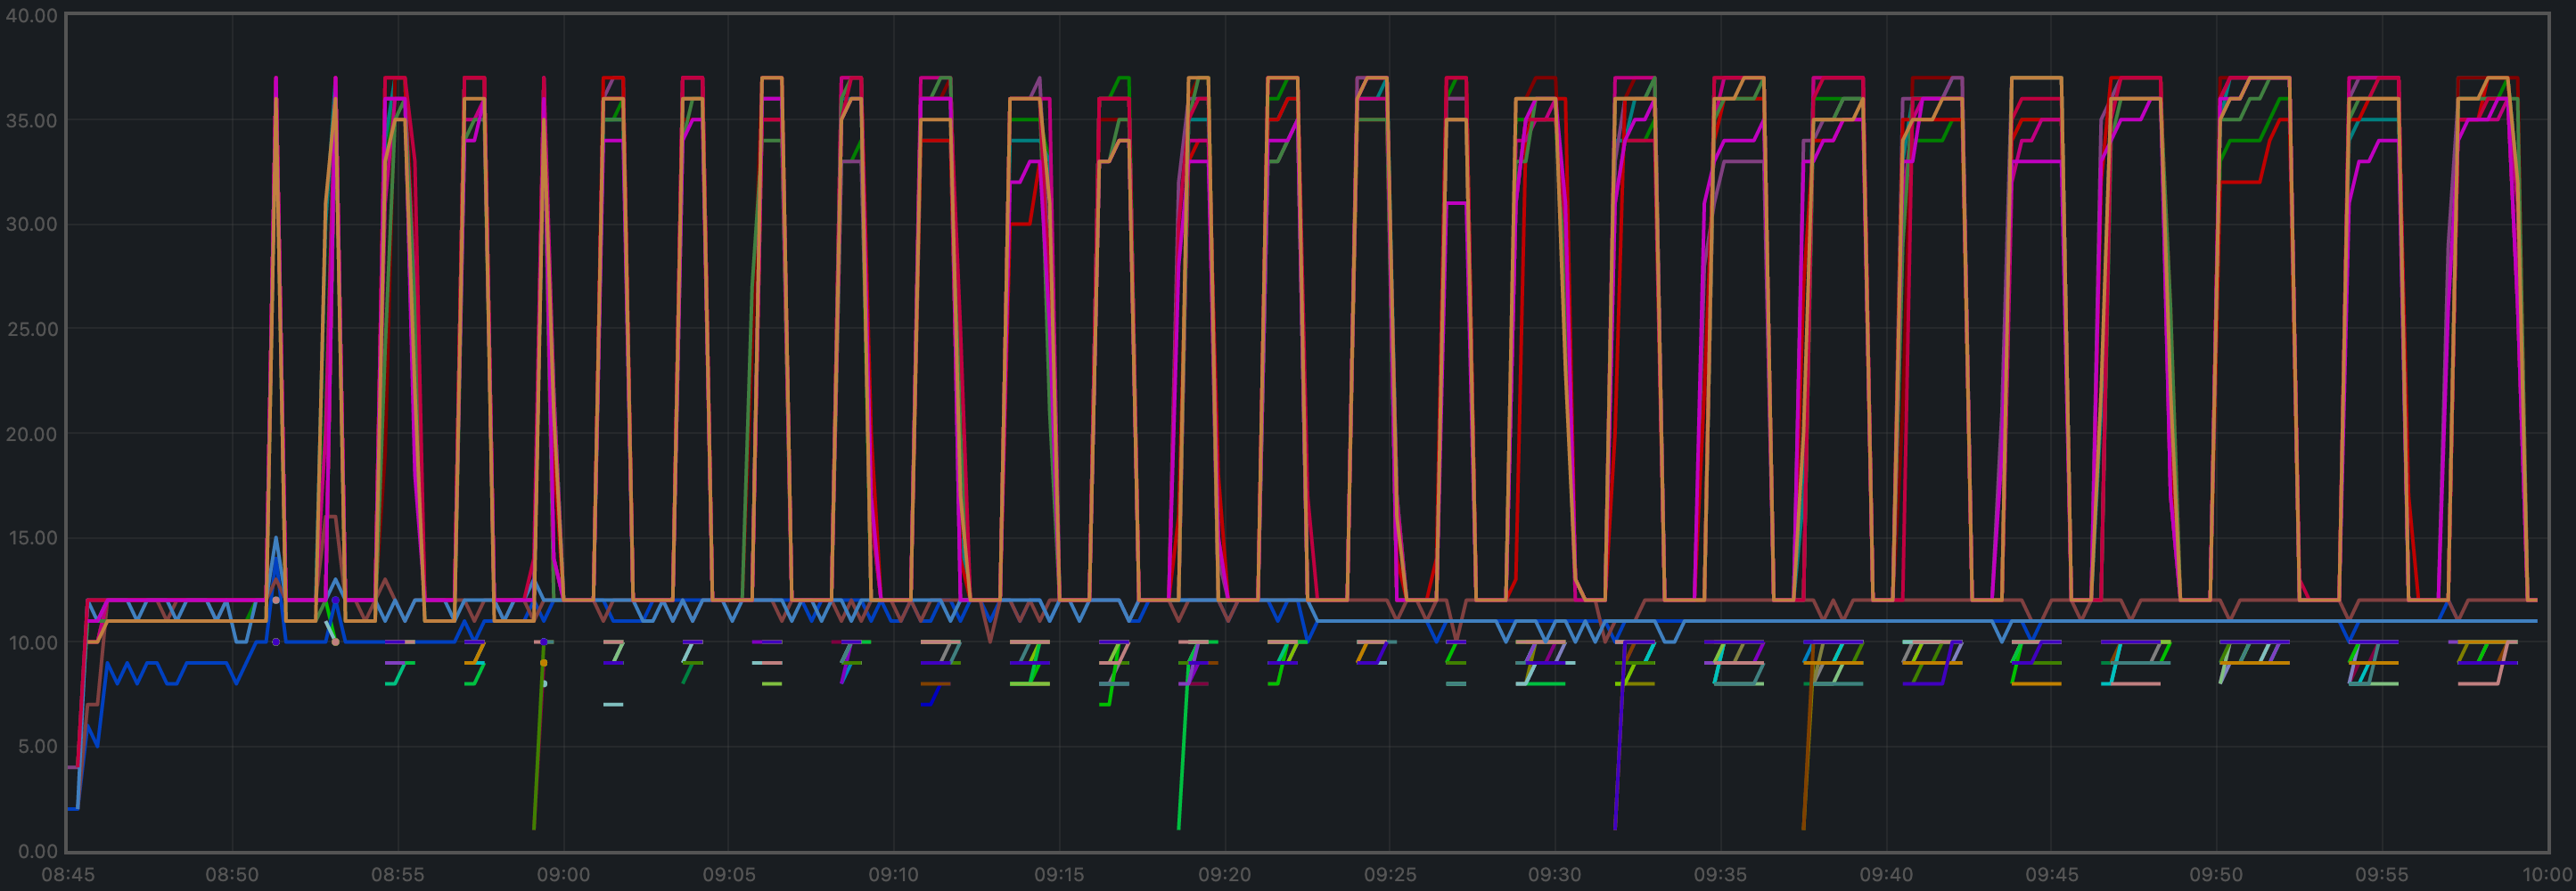
Memory Resident Set Size
The average Resident Set Size (RSS) over all processes looks slightly more stable onv0.37 (first plot) than on the baseline (second plot).
CPU Utilization
The plot shows metricload1 for all nodes.
v0.37 plot and the purple line in the baseline plot (v0.34)
correspond to the validators receiving all transactions, via RPC, from the load runner process.
In both cases, they oscillate around 5 (normal load). The main difference is that other
nodes are generally less loaded in v0.37.